
With consistent RevPAR growth above expectations this year, our RevPAR growth forecast for 2026 now reflects a strong 4.5%, a bounce back from the 0.3% decline in 2025. We expect continued favorable RevPAR growth this year, but at levels moderately below those posted from June through mid-July, as these first six to seven weeks of the summer vacation season were skewed by the World Cup events that fueled extraordinary ADR growth. In the trailing-28-day period ending July 18, national RevPAR was up 8.1%, according to STR/CoStar (June RevPAR was up 8.4%). This growth is nearly double the already robust increase for late April through May that we wrote about a month ago. The strong summer performance is building on what was already shaping up to be a solid year for the hotel industry, with healthy and relatively consistent RevPAR growth since February.
What is causing this rather remarkable RevPAR trend during a time of international conflict, lackluster employment growth, and continued uncertainty? We are ultimately experiencing a time when a significant segment of the public understands that this climate may be the “new normal” for now and it is time to enjoy a summer vacation, attend a convention, and meet for moving business forward. Many other key factors are contributing to the RevPAR expansion, which we have detailed in prior articles. Perhaps the most surprising was the 8.0%+ national RevPAR increase fueled by the 15% to 20%+ RevPAR spike recorded in many World Cup host cities. Games brought crowds together in non-host cities, as well, with viewing events and themed parties. Other factors driving the RevPAR trend include stronger convention calendars in many cities this spring, a surge in lodging demand in Minneapolis during heightened ICE enforcement activity in early 2026, and the Bay Area’s continued rebound as a hub for AI research and development, along with other market-specific drivers across the country.
As any hope of a lasting ceasefire in the Middle East seems to have faded at present, a portion of U.S. travelers who would have vacationed abroad for spring break and summer trips this year chose stateside destinations due to the conflicts and other perceived threats to a hassle-free, peaceful trip. Coupled with a rise in “revenge travel” following the cancellation or postponement of trips during a tumultuous 2025, these trends are boosting RevPAR, particularly in the luxury, upper-upscale, and upscale segments that include most resort properties. ADR growth is also being fueled by stubborn inflation, which remains in the 3.0% to 4.0% range, and the reality that hotel operators need to cover rising operational costs.
Our current U.S. forecast is as follows.
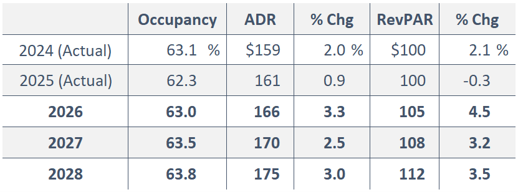

Looking ahead to the remainder of the year, August tends to be a slower month for travel, as summer heat kicks in and families prepare for a new school year. A robust fall convention season may then be on tap for September through November. Our 2026 forecast reflects an expectation of continued strong fall travel and ADR growth in light of the trends that unfolded this past spring. A slight pullback of ADR growth is anticipated for 2027, as the World Cup spike will not be repeated next summer. Conversely, we look forward to the 2028 Summer Olympics in Los Angeles and the benefits that event should bring to Southern California.
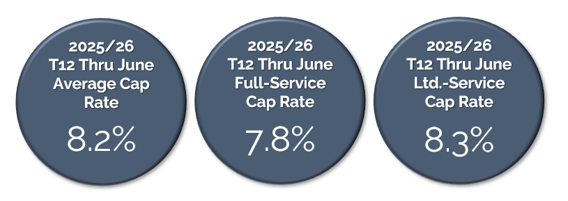
Transactions remain slow and steady this year given the uncertainty in the market during much of 2025 and going into 2026. But favorable 2026 performance is likely to lead to a more active transactions market in the second half of 2026 as improved cash flows help to narrow the buy-sell gap. The industry’s overall average cap rate for Q2 2026 fell to 7.7%. While fewer properties trading, those that have closed represent more upscale hotels commanding higher prices than those that sold a year ago, as reflected by the higher 8.2% cap rate for the trailing-twelve-month period (T12) ending June 2026.
Source: MSCI Real Capital Analytics (Closed U.S. Hotel Transactions)
We expect average cap rates to trend slightly upward in the second half of 2026, as we see more sellers start to meet the market and accept lower prices, which ultimately reflect higher cap rates. Sellers are increasingly understanding that the current market dynamics may not greatly improve in the near term. Persistent inflation is likely to keep any major downward movement in interest rates at bay as well. A normal cap rate in today’s market (for a stabilized or near-stabilized property) remains near the 8.0% to 8.5% mark, with an exit cap rate 100 basis points higher. Economy, extended-stay hotels and luxury hotels will likely trend below this level, while older limited-, select-, and full-service hotels facing a big renovation will likely trend above this mark.
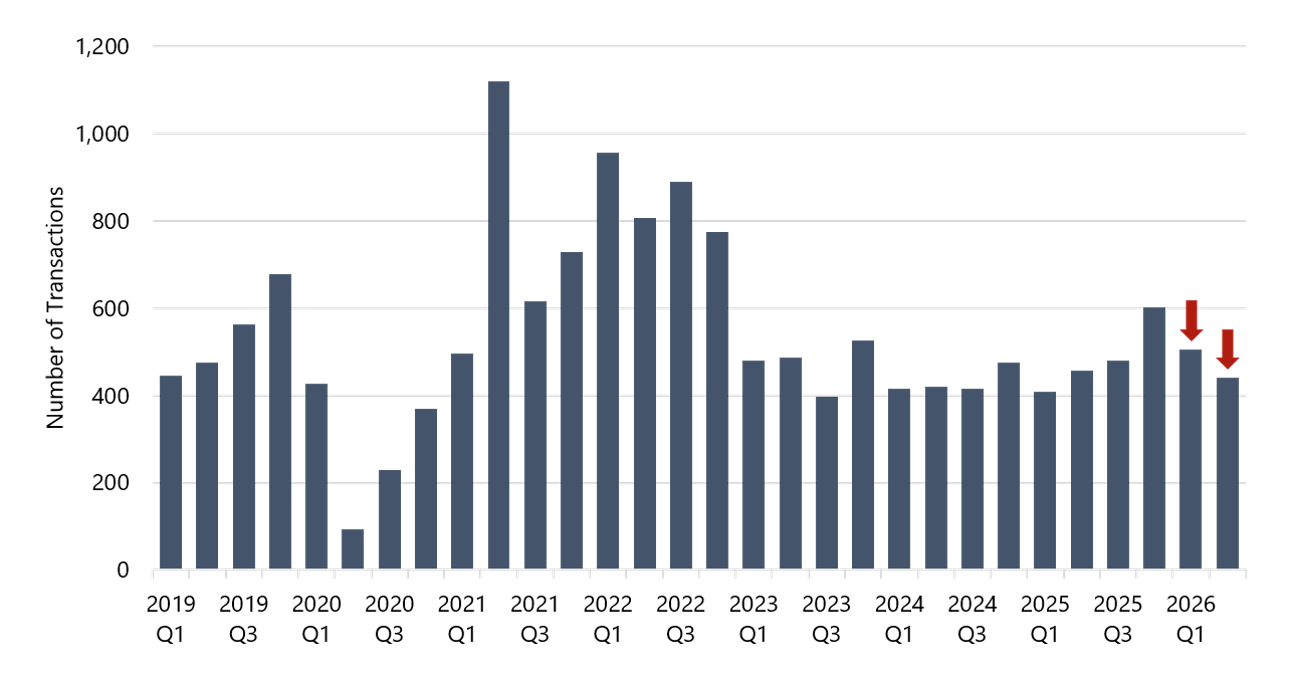
Sales volume remains healthy in 2026, with dollar volume for Q2 increasing 9.1% over Q1. However, this growth is attributed to higher sales prices, as fewer hotels are trading. Quarterly data for hotel transactions in the U.S. is shown below.
Source: MSCI Real Capital Analytics
Most hotel valuations continue to reflect discount rates in the 10% to 11% range, with some compression observed for luxury properties and assets located in high-barriers-to-entry markets. Valuations based on unusually low discount and exit cap rates for a typical limited-, select-, or full-service hotel warrant careful consideration. When reviewing hotels in low-barrier-to-entry markets, exit cap rates in the 6% to 7% range should prompt additional due diligence and review.
About HVS Leadership
At HVS Americas, our thought leadership is represented by our HVS Standards and Excellence Committee, comprising these leaders:
- Rod Clough, MAI, CRE, MRICS, President of HVS Americas
- Anne R. Lloyd-Jones, MAI, CRE, Director of Consulting & Valuation Services, National Practice Leader
- Katy Black, MAI, Managing Director, Leader of the Rocky Mountain Region and the HVS Americas Complex Consulting Group
- Tanya Pierson, MAI, ISHC, Senior Managing Director, HVS Minneapolis
- John Lancet, MAI, Senior Managing Director, Practice Leader of Southeast and Caribbean Regions
- Carrie Russell, AACI, MAI, RIBC, ISHC, Senior Managing Partner of HVS Canada
- Chelsey Leffet, Chief Operating Officer, U.S. Consulting & Valuation Division
- John Berean, Managing Director, HVS San Francisco and HVS Honolulu
- Ryan Mark, Senior Vice President, HVS Denver
- Marc Greeley, Senor Director, Leader of HVS Nashville Office
In total, we have a 35-person senior leadership team at HVS Americas composed of exceptional, experienced consultants. We are based in cities from Buenos Aires to Montreal and 40 additional cities in between, with teams covering all markets across North and South America. We are closely monitoring how this year is unfolding, and we are here to help when you need us.