Introduction
Chicago, America’s “Second City” or, in the words of the poet Carl Sandburg, the “City of the Big Shoulders,” has long enjoyed global recognition for its stories, intrigue, and ingenuity. The city’s tourist attractions, international companies, celebrities, special events, and North America’s largest convention center place it among the prime destinations in the U.S. for business, leisure, and conventions. The diverse neighborhoods surrounding the Loop are abundant in music, art, and culture, while Downtown Chicago’s commercial and tourist attractions include Willis Tower (formerly Sears Tower), Navy Pier, and Millennium Park.
Increases in tourism, business travel, and passenger traffic through both of Chicago’s airports led to record occupancy for the market in 2015. While an influx of new supply is anticipated over the next two years, the effect on occupancy should be minimal; the new hotels are expected to strengthen the market’s overall average rate over the long term.
Hotel Market Performance
Methodology
Average occupancy and ADR levels are calculated from a selected sample of data in the HVS database. The data set is composed of occupancy and ADR statistics from hotels located in a corresponding MSA with at least three years of historical data in the company database. The data are directly obtained and corroborated through our primary local market research. With years of expertise and industry relationships in the local market, associates collect or estimate any missing occupancy and ADR information. Additionally, RevPAR is calculated by multiplying collected occupancy and ADR for each year. For this report, the data sample comprises 63 limited-service and 91 full-service hotels in the MSA.
Overview of Historical Occupancy and Rate Trends
The following charts illustrate trends in hotel occupancy, average rate, and RevPAR for Chicago hotels from 2013 through 2015; the forecast period spans from 2016 through 2018.
Occupancy Peaked in 2015; Average Rate and RevPAR Forecast to Continue Growth
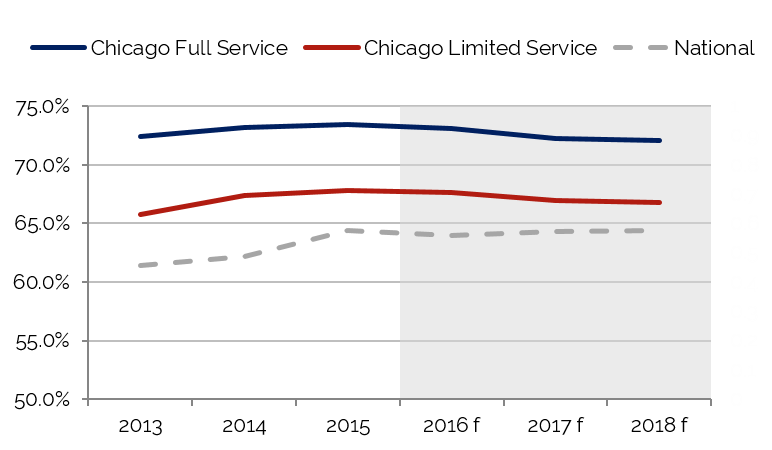
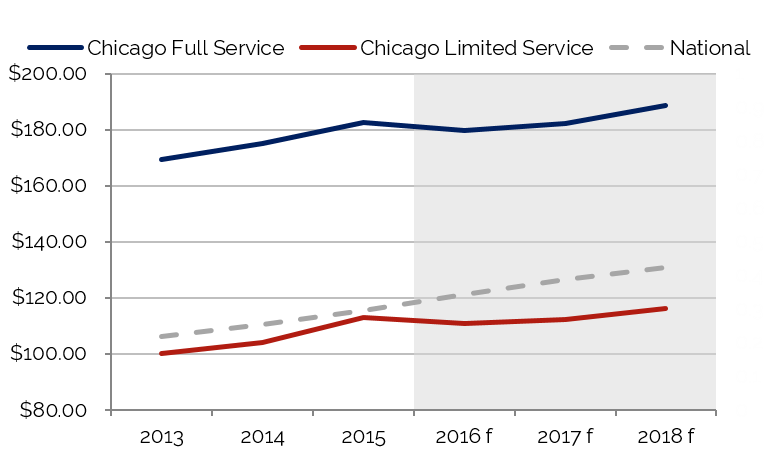
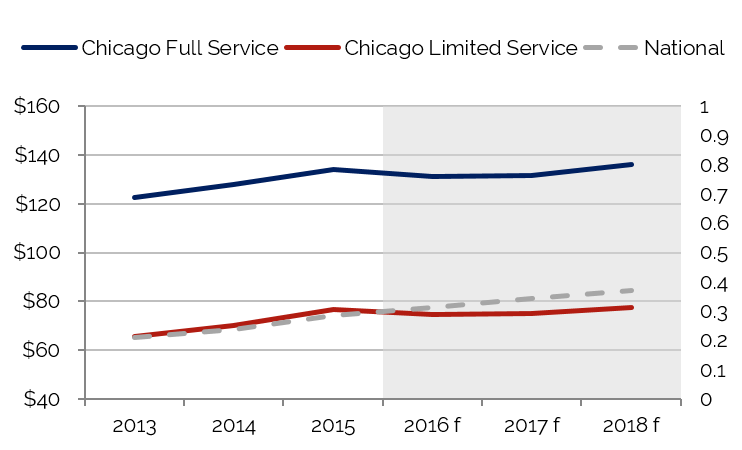
Source: HVS
Local employers and headquarters in the area, more than 244,000 square feet of office space, several major universities, a world-renowned convention center, and popular tourism attractions represent the primary sources of demand for the Chicago market. With the exception of the recession years from late 2007 through 2009, the Chicago metropolitan area has experienced demand growth since 2002. The ten-year historical trends indicate that occupancy peaked in 2007, just before the onset of the recession. The subsequent decline was compounded by new supply in 2008 and 2009. Occupancy levels have risen steadily since the market bottomed out in 2009. Occupancy fell just short of pre-recession levels in 2013 and easily surpassed the pre-recession levels in 2014 and 2015, despite the harsh winter experienced by much of the Midwest.
 Average rate in Chicago registered growth from 2004 through 2008. The strengthening economy and modest supply increases allowed local hotel operators to increase average rates on a consistent basis. Average rate growth began to slow in 2008, and rates experienced a steep decline in 2009, along with the contraction of the national economy; however, average rates bottomed out mid-year 2010. Average rates rebounded by year-end 2010, and this positive trend continued through 2015 as the national and local lodging markets began to normalize along with stronger economic conditions.
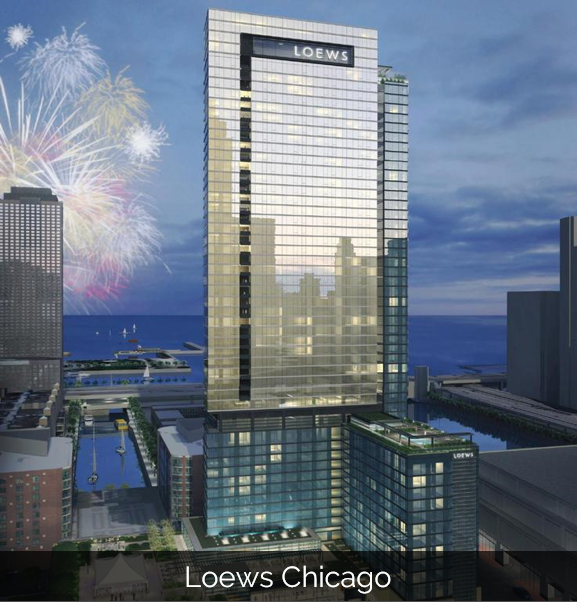
Hotel supply increases in Greater Chicago are expected to reach record levels over the next three years, especially in the downtown market. Notable openings in 2015 included the first Virgin Hotel, which opened in January, and the Loews Hotel, which opened in March. Additionally, a Hyatt Place and the first Hyatt Centric hotel opened in the spring of 2015. The Hampton Inn opened in June 2015 and the adjacent Hilton Garden Inn opened in August 2015. In addition, the LondonHouse – A Curio Collection hotel opened in May 2016. Located in the repurposed London Guarantee building along the Chicago River, the hotel will provide two stories of upscale retail, along with 452 luxury-boutique hotel rooms. The opening of these hotels demonstrates the growing popularity associated with continued development in the Loop neighborhood.
The proposed Marriott Marquis McCormick Place, scheduled to open during the third quarter of 2017, is perhaps the most talked-about project. The hotel will be located adjacent to McCormick Place and will add 1,200 rooms to the convention complex. Additionally, another 466 rooms are planned for a tri-branded hotel, to be connected to McCormick Place. Chicago officials have stated that these additional hotel rooms will allow the city to attract more major conventions to McCormick Place, the largest convention center on the continent. Nevertheless, the increases in convention hotel supply are anticipated to outpace convention demand in the coming years.
Hotel supply in the Chicago suburbs is also expected to increase significantly in the next few years, especially in Schaumburg. There are currently five hotels under construction in Schaumburg, for a supply growth rate of 12.8% between now and the end of 2017. There are another 1,000 hotel rooms currently under construction in the Chicago metro area. The majority of these hotels fall into the upper-upscale categories.
Despite significant supply growth in 2015, occupancy levels reached record levels, the result of exceptionally strong demand increases. Supply growth is forecast to outpace demand growth in 2016, which will lead to a slight decline in occupancy levels. Demand growth is anticipated to be strong in 2017, led by increased convention business at McCormick Place and additional demand generated by the opening of the 1,200-room Marriott Marquis and the new DePaul Arena; however, overall occupancy levels are expected to decline given the significant increases in room supply that year.
RevPAR growth will be largely influenced by increases in average rate. As new hotels open and older properties renovate in order to stay competitive, average rate growth for hotels in the Chicago market will be tempered.
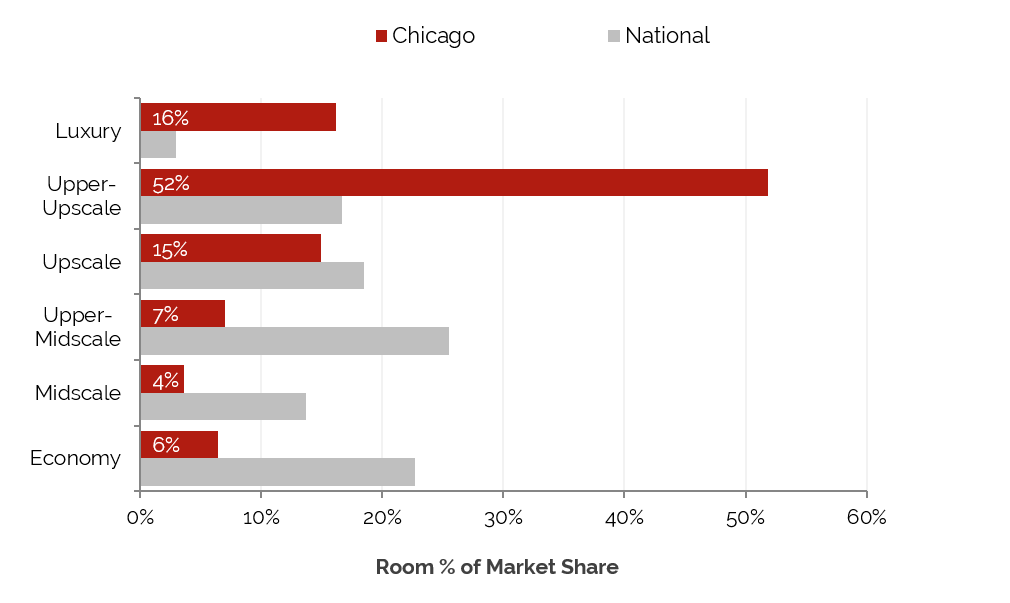
Existing Supply Breakdown by Brand and Scale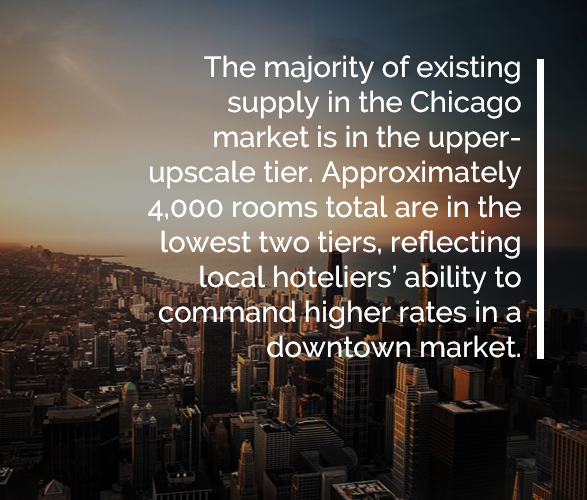
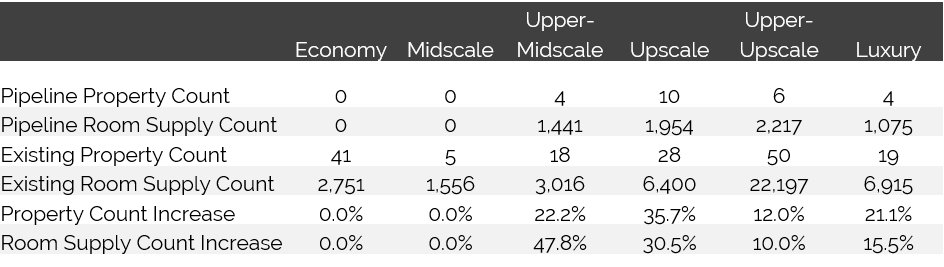
In the greater Chicago market, meeting and group demand is accommodated by a number of sizable, upper-upscale hotels that offer full-service amenities and large amounts of flexible meeting space.
Upper-upscale hotels account for most of the hotels in the market, with 52% of the supply, or 22,197 rooms. Although there are 41 economy hotels in the MSA, they account for only 6% of the market’s hotel room supply.
Upper-Upscale Hotels Represent Largest Portion of Rooms in Chicago
while Upper-Midscale Class Leads the Nation
Source: HVS & STR
New Supply Pipeline
The table below reflects an increase of approximately 1,168 rooms in 2016, in addition to the existing supply of approximately 42,835 rooms already in the city of Chicago. This represents an approximate supply increase of 9.8% for just the city in 2016.
Majority of New Hotels Are Expected in the Loop and West Loop Neighborhoods
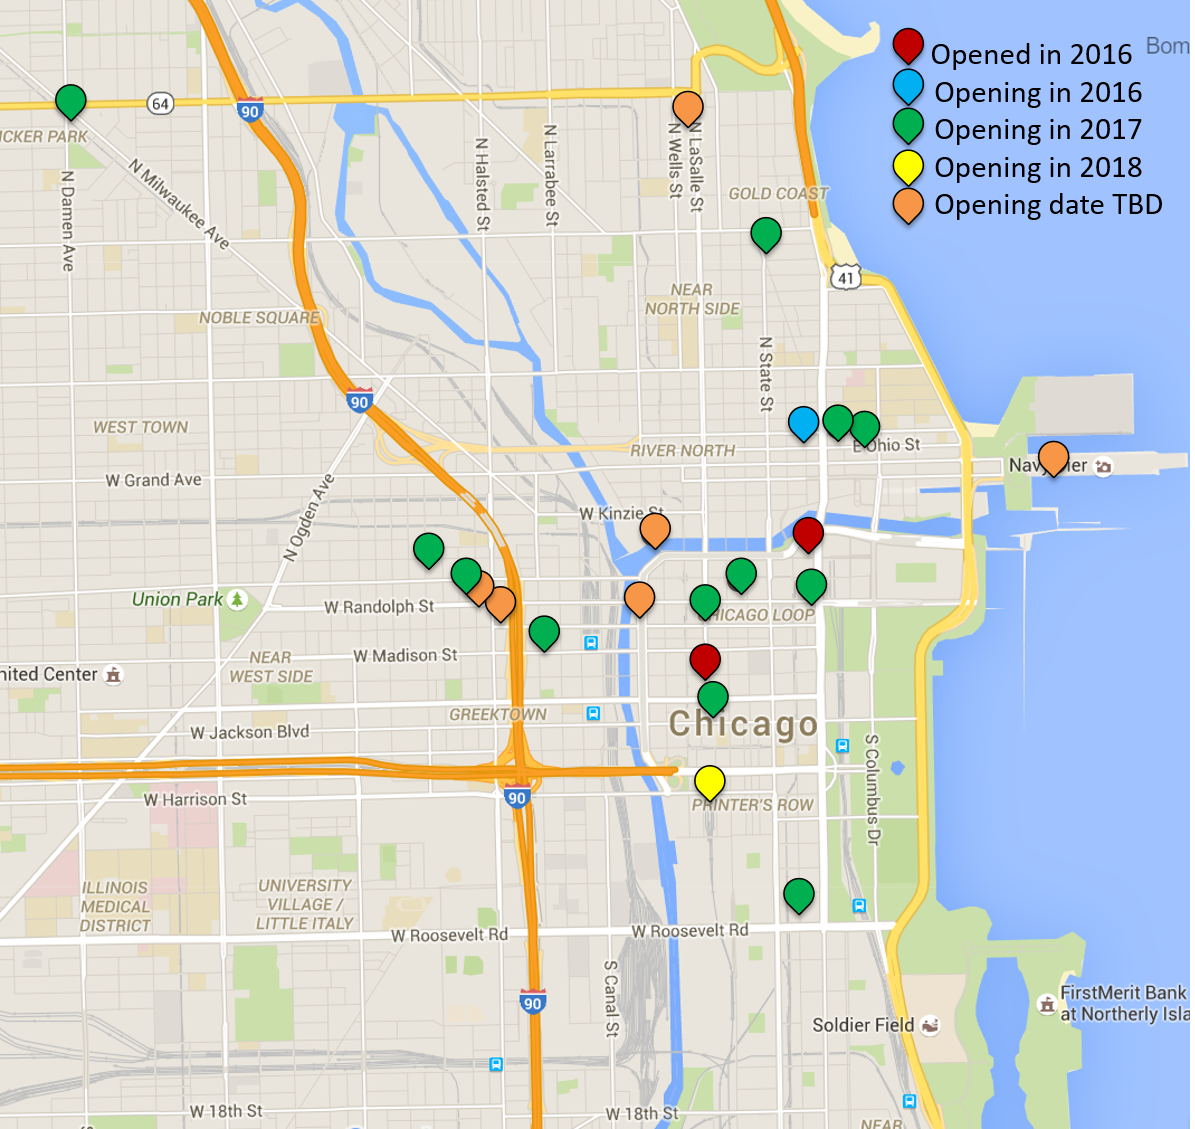
After several years of stability, new supply increased in 2013, 2014, and 2015, a trend that is anticipated to continue through at least 2017. Around 19 hotels and more than 5,100 rooms are expected to enter the city of Chicago by the end of 2017. With this anticipated increase in supply, we expect occupancy to dip moderately and average rate to continue to grow, albeit at a slower pace. Chicago hotel values should continue to increase in general, albeit at a slower pace than the double-digit growth realized in the post-recession period.
Chicago’s Upscale Hotel Room Inventory Expected to Increase more than 35%;
Upper-Midscale and Upper-Upscale Inventory to Stabilize*†
Source: HVS & STR
* Only includes properties with room counts and class designations
† Only the lowest value in the rooms range is considered
Hotel Transactions
The following table details confirmed hotel transactions in Chicago in the last three years.
The City of Chicago Leads Per-Key Sales and Remains the Most Active Market of the MSA
Source: HVS & RCA
Chicago-area hotel sales over the past three years have ranged from a high of $592,063 per key down to $11,000 per key, with pricing highly dependent on historical operations, location, product type, and if the property was under financial distress. Historically, Chicago transaction volumes have been modest, as long-term investors have been attracted to the stability of this market. Ho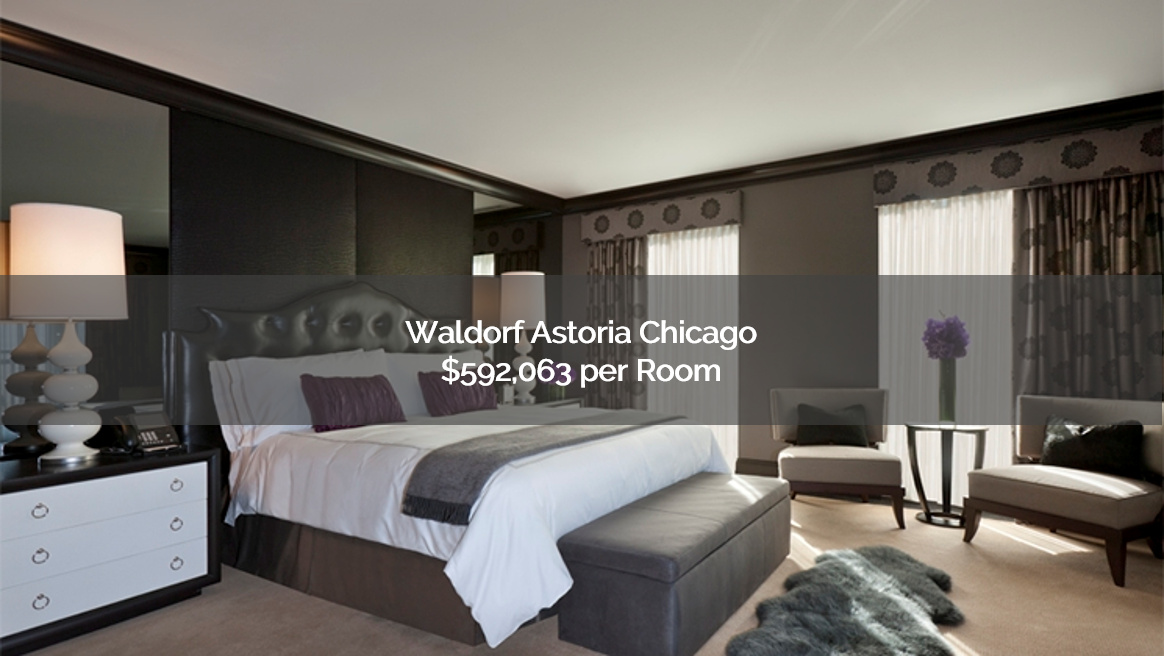 tel values have increased because of the upside potential of the Chicago market, which has drawn strong interest from the investor community. Since 2011, the largest transactions have been the Waldorf Astoria ($111,900,000 or $592,063 per room), the Sofitel Chicago Water Tower ($153,000,000 or $368,675 per room), the Renaissance Chicago Hotel ($139,000,000 or $251,356 per room), the Loews Chicago ($156,312,500 or $390,781 per room), the W Chicago City Center ($128,800,000 or $350,000 per room), the W Chicago Lakeshore ($126,000,000 or $242,308 per room), Hotel Lincoln ($73,000,000 or $396,789 per room), and Public Chicago ($61,500,000 or $215,789 per room). Several hotels are currently listed for sale in the downtown and suburban submarkets, including trophy assets like the the Thompson Hotel, the Palmer House Hilton, the Kinzie Hotel, the Tremont Hotel, and the Hotel Indigo Gold Coast.
Transactions and developments are expected to remain strong in the near future. Growing demand for office space and residences in the West Loop will push development further west, while existing hotels in the Loop and River North area are likely to sell given the limited available land for new development. Many historic conversions are occurring in Downtown Chicago. Despite the complexity of these projects, seasoned investors are targeting these developments, drawn by higher expected returns and the limited available space for new development in the downtown area. Given the vibrant economic and social environments of the city, the outlook for the lodging market in Chicago remains positive.
Average Price per Key in the U.S.
Source: RCA
Key Economic Indicators
Economic and Demographic Review
The U.S. population grew at an average annual compounded rate of 0.9% from 2010 through 2015, and that rate is forecast to continue into 2020. Cook County’s population growth lagged behind that of the nation, at 0.3% for the period from 2010 to 2015, projected to grow at an annual compounded rate of only 0.3% into 2020.
The average annual compounded growth rate of per-capita personal income of 0.9% for the county between 2010 and 2015 lags the national average of 1.2%. Projections expect Cook County, the state of Illinois, and the nation to pace at 1.3% into 2020.
The national wealth index for the country trended flat from 2000 to 2015; it is anticipated to remain flat into 2020. The wealth indexes for Cook County and the state of Illinois are also expected to remain flat into 2020.
Food and beverage sales in the county totaled $10.335 billion in 2015, versus $9.552 billion in 2010. This reflects a 1.7% average compounded annual change. Through 2020, the pace of growth is projected to moderate slightly to 1.1% for the county, lagging the national anticipated national growth rate of 1.9%.
Population Growth in Chicago is 30% lower than that of the nation.

Per-Capita Personal Income for the Chicago MSA is 24% lower than that of Nation from 2010 to 2015
"Chicagoland Map". Licensed under Public Domain via Commons
The retail sales sector for the county totaled $65.668 billion in 2010 and grew to $72.016 billion in 2015; it is projected to reach $76.380 billion in 2020. The compounded annual growth rate from 2010 to 2015 was 1.9%; it is projected to moderate to 1.2% into 2020. This is less than both the forecasted U.S. annual compounded growth rate of 2.0% and the state’s rate of 1.5%.
Radial Demographic Indicators
The following table reflects radial demographic trends for the market area measured by three points of distance from the center of Downtown Chicago.
Demographics by Radius from the Center of Downtown Chicago
One-Mile Radius 2016-2021

Five-Mile Radius 2016-2021

Source: The Nielsen Company
Top Five Occupations – Estimated for 2016


Source: The Nielsen Company
Population growth within one mile of the center of Downtown registered a significant 64.4% from 2000 to 2010, moderating to 16.3% from 2010 to 2016; it is anticipated to shift down to 8.6% per year from 2016 to 2021. This growth has resulted in a population increase from 25,941 people, according to the 2000 U.S. Census, to an estimated population of 49,608 in 2016; the population in this radius is expected to grow to 53,858 by 2021. Concurrently, the population in the greater ten-mile radius declined in the decade leading up to 2010 and grew to 1.4% from 2010 to 2016; it is anticipated to level off at 1.0% growth into 2021. From 2000 to 2010, this area’s population declined from 2.758 million to 2.607 million. The population increased in 2016 to an estimated 2.642 million, but at a predicted 2.670 million in 2021.
Within a one-mile radius of Downtown Chicago, the number of households moved at a relatively consistent pace with the population. Households in the greater ten-mile radius, like the overall population, also declined from 2000 to 2010, but growth resumed, and household growth is expected to outpace the growth rates for the population from 2010 through 2020. The 2000 U.S. Census reflected 955,461 households in the ten-mile radius; projections call for 1.0 million by 2020.
2016 Forecast - Average and Median Household Income
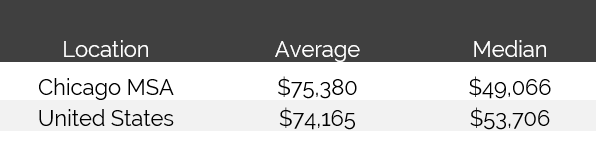
Source: The Nielson Company
Workforce Characteristics
The characteristics of an area’s workforce provide an indication of the type and amount of transient visitation likely to be generated by local businesses. Sectors such as finance, insurance, and real estate [FIRE]; wholesale trade; and services produce a considerable number of visitors who are not particularly rate-sensitive. The government sector often generates transient room nights, but per-diem reimbursement allowances often limit the accommodations selection to budget and mid-priced lodging facilities. Contributions from manufacturing, construction, transportation, communications, and public utilities [TCPU] employers can also be important, depending on the company type.
Woods & Poole Economics, Inc. reports that during the period from 2000 to 2010, total employment in the county contracted at an average annual rate of -0.4%. This rate was below the growth rate recorded by the MSA, which remained flat, and the national average of 0.8%. More recently, the pace of employment growth in the county expanded slightly to 0.9% on an annual average from 2010 to 2015. Woods & Poole Economics, Inc. anticipates that total employment in the county will change by 0.8% on average annually through 2020. The county trend is almost 40% less than the forecasted rate of change of 1.3% for the U.S. as a whole.
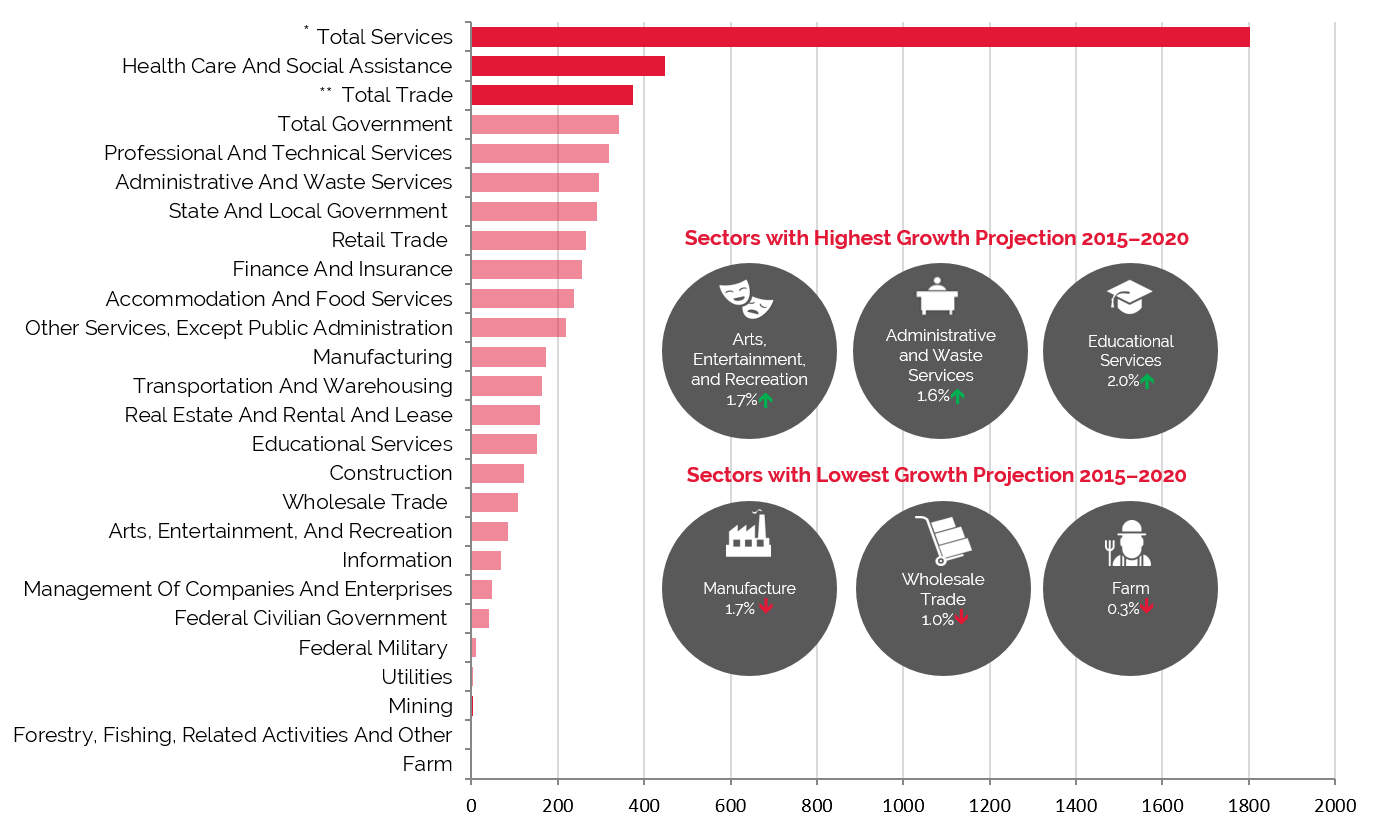
As stated above, finance, insurance, and real estate [FIRE]; wholesale trade; and services generate demand for the upper-midscale through luxury class of hotels. These sectors combined represented 65.8% of total employment in 2015, with an average annual compounded growth rate for the group expected to be approximately 0.4% into 2020.
The largest primary sector was Total Services, which recorded the highest increase in number of employees during the period from 2010 to 2015, increasing by approximately 134,300 people (8.6%) and rising from 48.4% to 50.3% of total employment. Of the various sub-sectors included in Total Services, Health Care & Social Assistance was the largest employer.
Considered a room-night driver for economy hotels, Total Government employment has been contracting in the Chicago area, resulting in a compounded annual growth rate of -0.2% from 2010 to 2015. Although the growth rate for 2015 into 2020 for the sector is expected to increase to 0.1%, Total Government will lose 0.3% of the total employment share.
Employment Projections through 2020 Show the Highest Growth in Total Services
and Continued Declines in Manufacturing
Source: Woods & Poole Economics, Inc.
* Total Services include Professional and Technical Services; Management of Companies and Enterprises; Administrative and Waste Services; Educational Services; Healthcare and Social Assistance; Arts, Entertainment, and Recreation; Accommodation and Food Services; and Other Services, except Public Administration
** Total Trade includes Wholesale Trade and Retail Trade
Employment
Total employment in the Chicago market has experienced year-over-year growth since 2010, as the economy began to strengthen following the national recession. Though the strongest growth has occurred in Office Employment, Industrial Employment also began to grow in 2010 after continuously declining since 2002. A return to manufacturing in the Chicago market, led by the healthcare and pharmaceutical sectors, has contributed to this growth. We expect overall employment to continue to move upward in the near future, led by office employment growth.
The following table illustrates historical and projected employment, population, and income data for the overall Chicago market, as presented by REIS.
Historical & Projected Employment, Households, Population,
and Household Income Statistics for Chicago
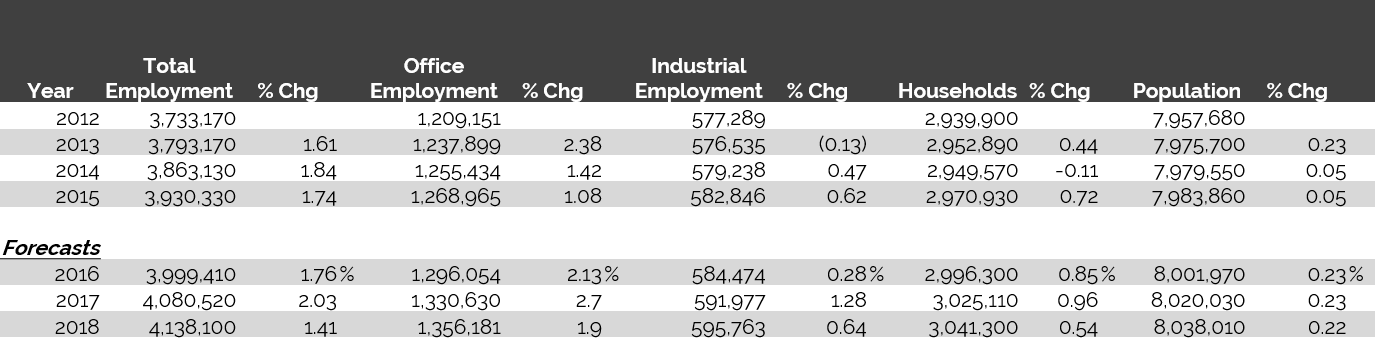
Source: REIS Report, 2nd Quarter, 2016
Top Industries In Chicago
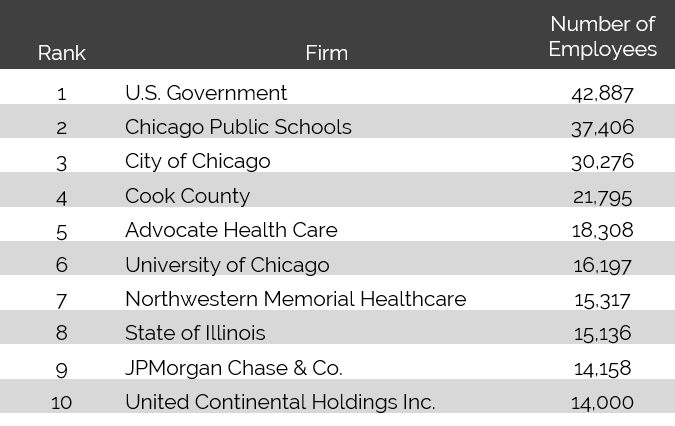
Greater Chicago owes its economic strength in large part to the presence of over 30 Fortune 500 companies headquartered in the area, spanning finance, technology, manufacturing, and food services. Since mid-year 2011, over 26,000 jobs at more than 1,000 companies have been announced, including 25 new headquarters in the Chicago area. New companies are drawn to Chicago for its modern transportation infrastructure, central location, affordable cost of living, and world-class attractions.
Government, Education, and Healthcare Entities Dominate Employment Landscape in Chicago
Source: Crain’s Chicago Business, 2016
Fortune 500 companies in the greater Chicago area include Boeing, Walgreens Company, Allstate Corporation, United Airlines, Kraft Heinz, McDonald's Corporation, Abbott Laboratories, and Exelon. The city is also home to several federal entities, including the headquarters for the 7th Federal Reserve Bank District, the U.S. Court of Appeals for the 7th Circuit, and the Northern Illinois Bankruptcy Court. Chicago is also well known as a major center of global agricultural commodity trading, overseen by the Chicago Board of Trade and the Chicago Mercantile Exchange (CME). The CME handles the trading of ethanol, corn, oats, ice, soybeans, wheat, live hogs, pork bellies (bacon), and live cattle.
Several health services and pharmaceutical companies support the region's medical industry by offering the latest state-of-the-art equipment, medicine, and care. According to Woods & Poole, Health Care & Social Assistance account for more than 12% of the greater Chicago area's workforce. In addition, the Chicago area features 6 medical schools and 47 teaching hospitals, with Northwestern Memorial Hospital, University of Chicago Medical Center, and Rush University Medical Center representing the largest facilities. Northwestern broke ground on its new Biomedical Research Center in early 2015. The new building will include 600,000 square feet of laboratory space for biomedical research in its first phase of development, with a full build-out to include 1.2 million square feet of space. Nearby, construction is well underway on the Rehabilitation Institute of Chicago's new state-of-the-art medical facility. The project, which has been estimated to cost $523 million, will include 900,000 square feet of cutting-edge "Ability Labs," 242 patient beds, an auditorium, indoor parking, and a tenth-floor sky lobby. The facility will open in early 2017. Chicago's extensive healthcare sector also supports the growing biotechnology and pharmaceutical sectors. MATTER Chicago, a health-tech incubator, opened in early 2015; the company provides funding, support, and work space for local startups that are focused on health care.
Chicago is home to the retail financial services and commercial banking headquarters of JPMorgan Chase, one of the largest employers for the market. JPMorgan Chase is the second-largest bank in the nation, behind Bank of America. Wells Fargo, the nation's fourth-largest bank, consolidated resources and opened a new regional headquarters at the CME Center in Downtown Chicago in 2013. Although not well known in Chicago, the company employs more than 2,100 people in the area, with plans to expand to satellite commercial lending offices in the Chicago suburbs. In addition, Chicago is home to one of the nation’s twelve Federal Reserve Banks, as well as the Chicago Stock Exchange.
Unemployment
After showing year-over-year improvement, unemployment began to rise in 2007 as the region entered an economic slowdown, and this trend continued through 2010 as the height of the national recession took hold. According to estimates provided in published accounts, unemployment levels in the state of Illinois in the first quarter of 2010 reached an almost 27-year high because of the severe contraction in both the national and local economies. However, the remaining nine months of 2010 registered improvements as the region entered into a recovery period. The positive trends exhibited during the latter half of 2010 continued through 2012, with unemployment rates remaining flat in 2013. Unemployment rates decreased again in 2014 and 2015 as the economy continued to grow.
Unemployment Rate Trending Toward Pre-2008 Rates
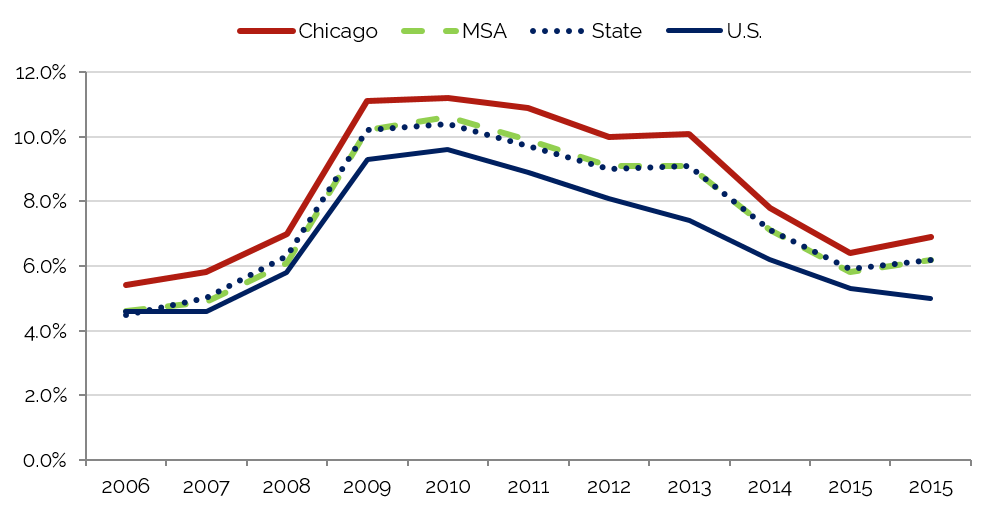
Source: U.S. Bureau of Labor Statistics
The greater Chicago area offers a diverse labor force, and economic development officials remain optimistic, particularly regarding corporate employment in the private sector.
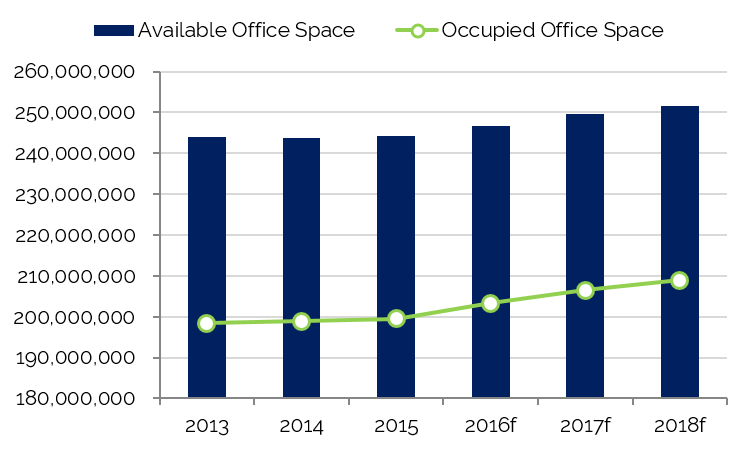
Office Space
Trends in occupied office space are typically among the most reliable indicators of lodging demand, as firms that occupy office space often exhibit a strong propensity to attract commercial visitors. Thus, trends that cause changes in vacancy rates or in the amount of occupied office space may have a proportional impact on commercial lodging demand and a less direct effect on meeting demand. The following table details office space statistics for the pertinent market area.
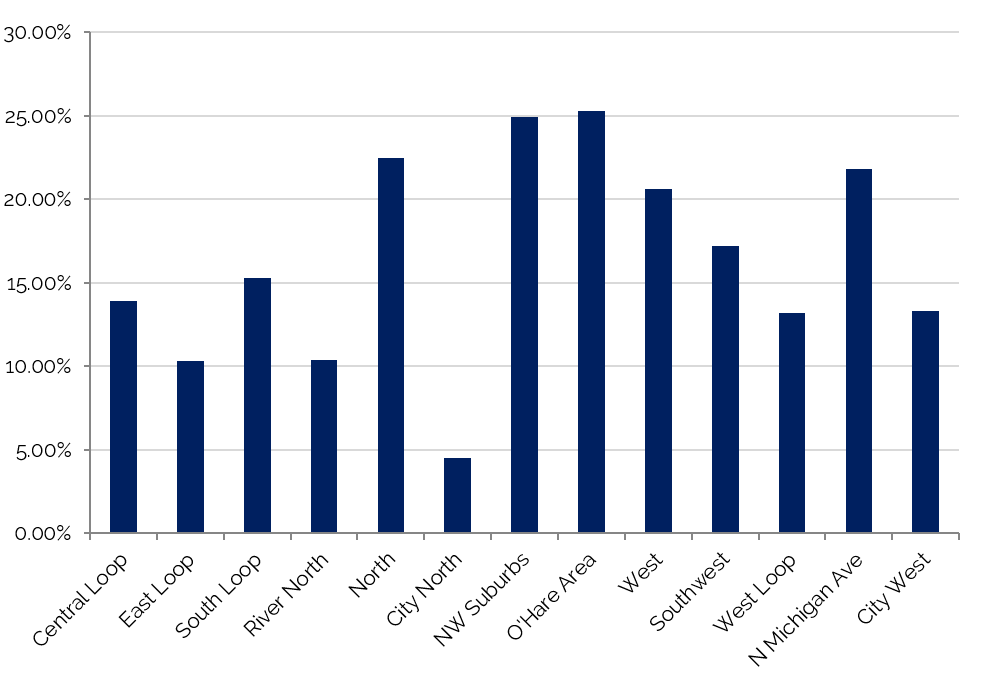
West Loop Features the Most Office Space in Chicago
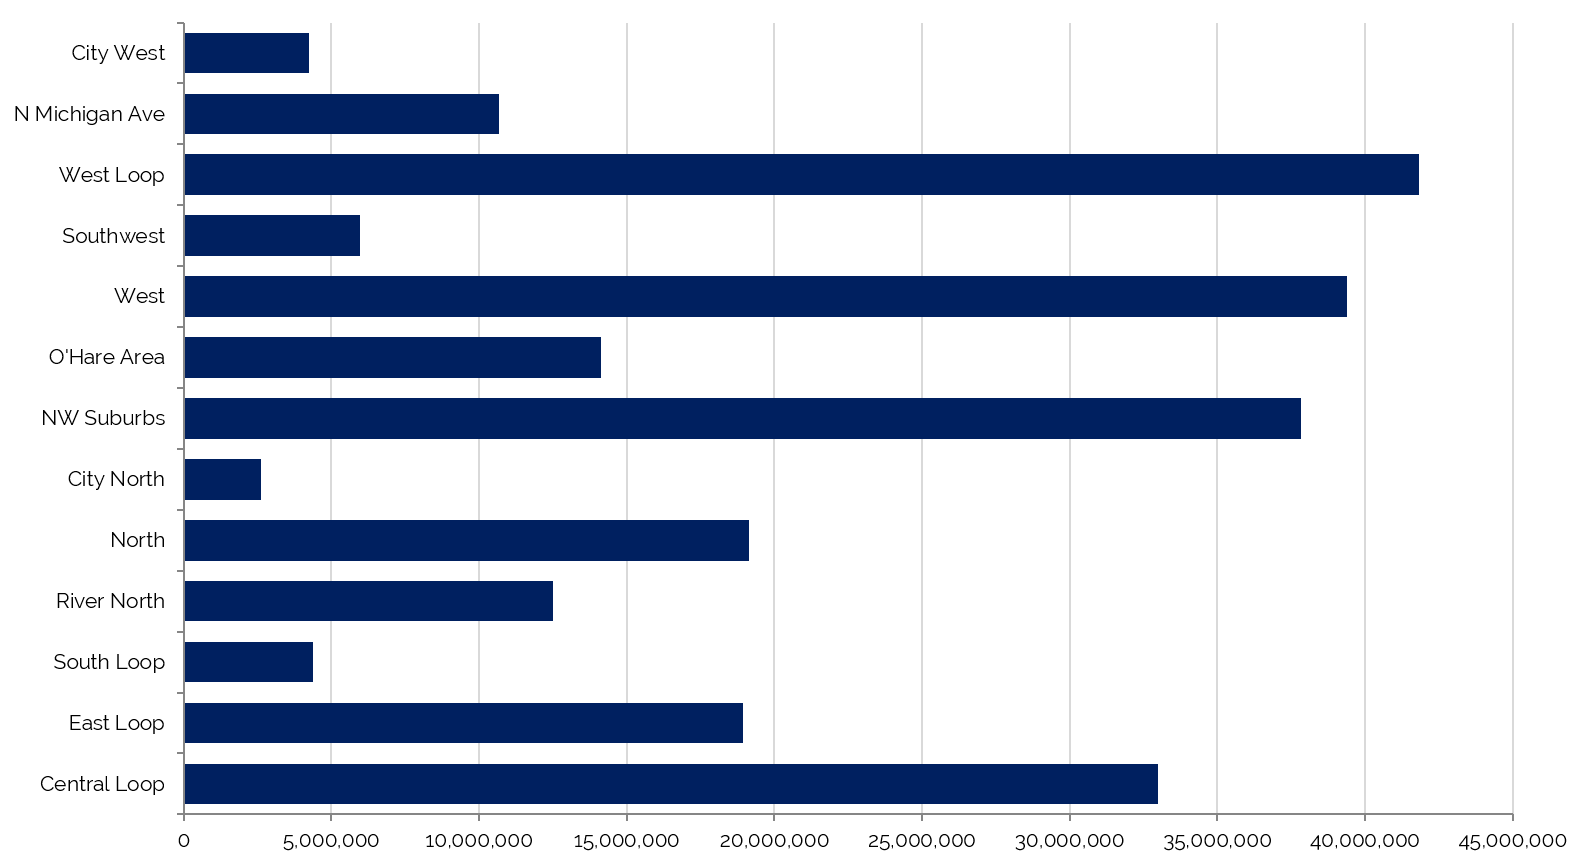
Source: REIS Report, 2nd Quarter, 2016
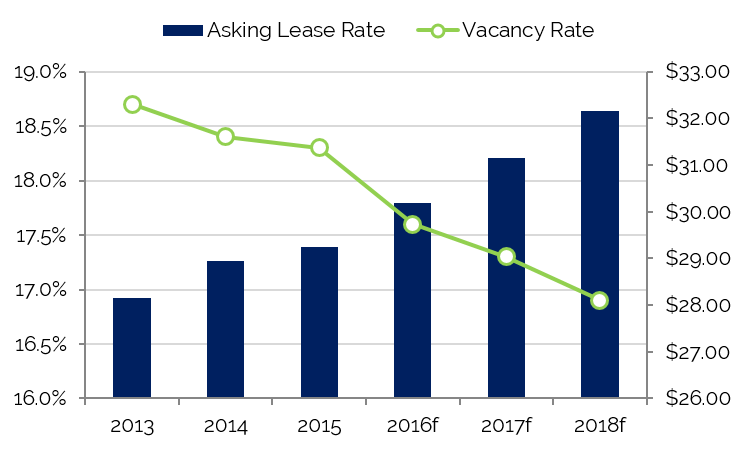
The greater Chicago market, which comprises over 244 million square feet of office space, is undergoing a boom of redevelopment, gentrification, and business expansions. A total of more than 500,000 square feet of new office space entered the market in 2015. As of second-quarter 2016, the market reported a vacancy rate of 17.8% and an average asking rent of $29.68. The East Loop, West Loop, and North Michigan Avenue submarkets are currently experiencing the most growth. The North Michigan Avenue submarket houses approximately 10.7 million square feet of office space. The submarket's vacancy rate of 21.8% is the highest in Downtown Chicago, most likely due to the high lease rates; North Michigan Avenue trails only the West Loop submarket in terms of asking rent. North Michigan Avenue, however, offers an ideal location for those businesses willing to pay for high-class office space near the Loop and a multitude of transportation options. The West Loop market has one of the lowest vacancy rates in Downtown Chicago and is transforming from an area of old industrial buildings and cheap housing to a neighborhood that boasts some of the top restaurants in Chicago, new hotel and residential developments, and high-end clients like Google.
There has also been a recent trend in the area of major corporations moving their operations to the downtown area in order to recruit and retain younger workers. The latest high-profile companies to move headquarter offices include Kraft Heinz, Motorola Solutions, and ConAgra Foods.
Downtown Chicago Vacancy Rates Decline as More Companies Return to the City
Convention Activity
Convention centers generate significant levels of demand for area hotels, particularly those within a radius of three miles. Convention headquarters hotels command premium rates and, in addition to capturing event-related demand, can benefit from hosting related banquet events. Major conventions also push demand to peripheral hotels in the market.
Chicago's McCormick Place, owned by the Metropolitan Pier and Exposition Authority (MPEA) and operated by SMG, is the largest convention center in the United States and North America, with a total of 2.6 million square feet of exhibition space. The West Building offers a 460,000-square-foot exhibit hall, 250,000 square feet of meeting space, and a 100,000-square-foot ballroom—Chicago's largest. McCormick Place offers three other state-of-the-art buildings, including the South and North Buildings and the Lakeside Center. The North Building features over 700,000 square feet  of exhibition space, 29 meeting rooms, and various service areas and support facilities. The Lakeside Center concentrates on hosting mid-sized trade shows and conventions, while the South building offers an additional 840,000 square feet of exhibition space and 156,000 square feet of meeting space. McCormick Place also features the Arie Crown Theater, a 4,249-seat performing arts venue that doubles as a general assembly hall.
The entire McCormick Place complex is linked by a 50,000-square-foot pedestrian promenade, referred to as the Grand Concourse, which contains retail shops and other visitor amenities. MPEA also owns the 800-room Hyatt Regency McCormick Place, which is connected via the Grand Concourse. In June 2013, the Hyatt Regency completed a $110-million renovation and expansion that included adding a 460-guestroom tower, completely updating the hotel, and renovating and expanding the meeting space. In early 2013, city officials announced another planned expansion of the McCormick Place complex, including a $173-million, 10,000-seat arena and an additional 1,200-room, $421-million Marriott Marquis headquarters hotel, to be developed by the MPEA. The hotel development, which will be supported with up to $55 million in Tax Increment Financing (TIF), is projected to open in late 2017. Additionally, another 466 guestrooms are proposed as part of a tri-branded hotel that will be connected to the convention center and include extended-stay and select-service guestrooms and amenities.
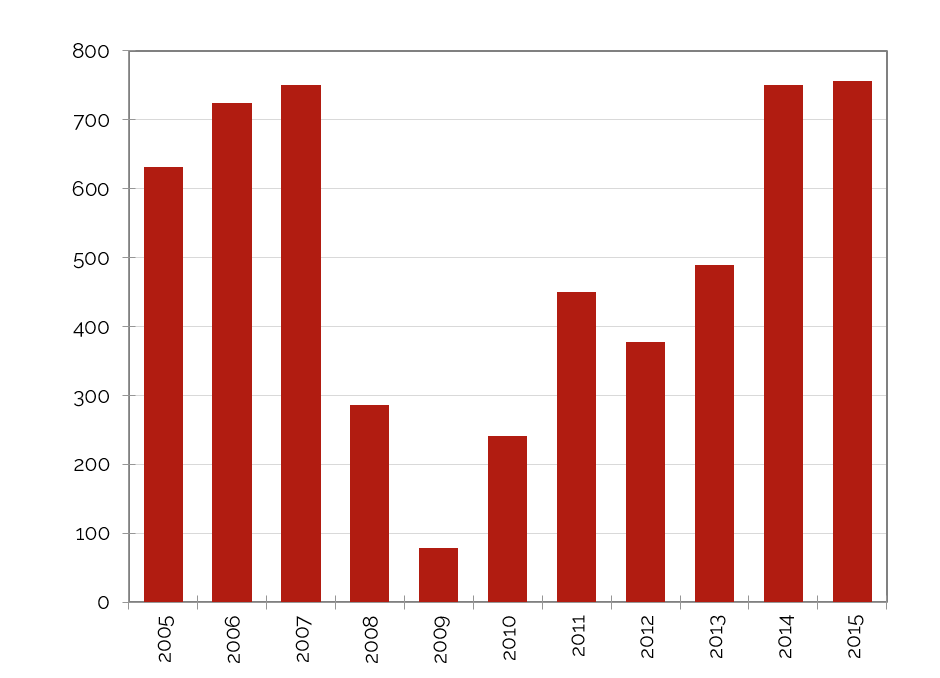
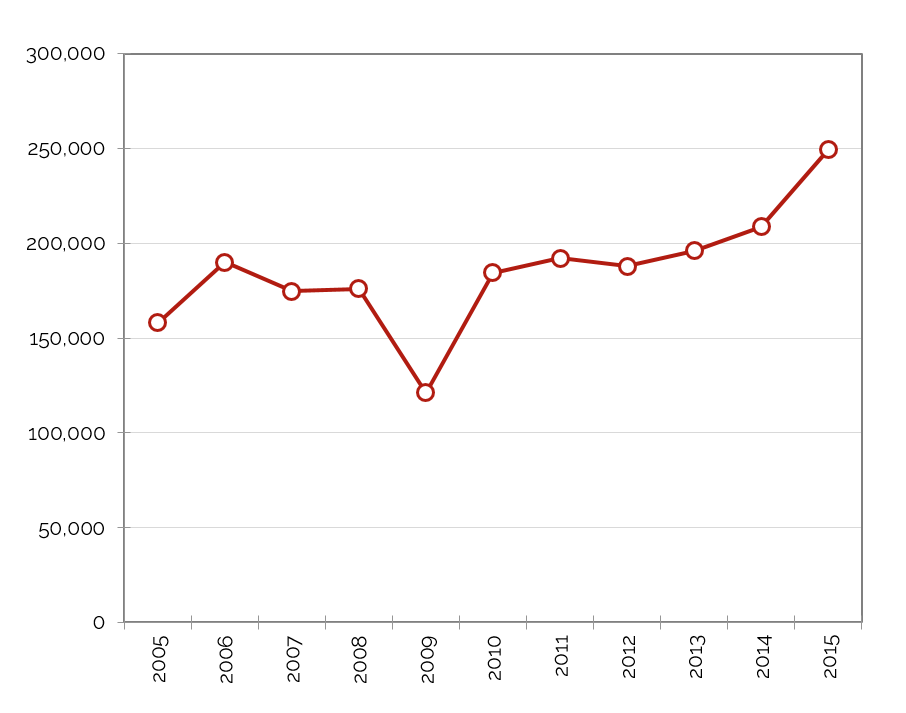
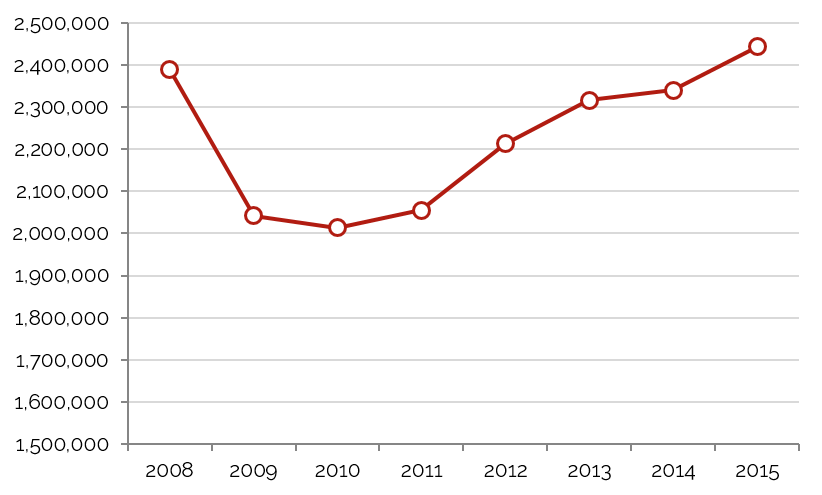
The level of room-night production by McCormick Place depends on large events that each generate between 50,000 and 100,000 room nights. Many of these large events rotate among major U.S. convention centers, and the cycle of these bookings is primarily responsible for year-to-year variation in room-night generation in Chicago. The number of reported room nights is also influenced by the level of attendance at events, which suffered during the recessionary years, particularly in 2009 and 2010. Furthermore, many convention delegates book directly with hotels or through online channels; these room nights are not included in the reported pick-up of room blocks provided by the MPEA. The trend of booking outside the room block appears to be growing, but no reliable statistics are available to measure the number of room nights booked through other channels.
Number of Attendees Exceeded 2.4 Million in 2015
Source: McCormick Place
The data show that the number of major events has fluctuated in recent years; however, total attendance has continued to increase since 2011, surpassing the pre-recession high in 2015. The number of trade shows has reportedly increased along with overall attendance since 2011, when the unions at McCormick Place agreed to new work rules that lowered the costs of exhibiting at the center; the same year, SMG took over management of McCormick Place, and the MPEA implemented other state-mandated cost reductions. MPEA reports that these changes have positively influenced the ability to book future business. The addition of the 1,200-room Marriott Marquis could also improve the ability of the MPEA to book smaller conventions that use both adjacent hotels and the West Building. Although year-to-year room-night production is likely to continue to vary greatly as large events come and go, room-night generation could reach 1.5 million by 2020.
Airport Traffic
Airport passenger counts are important indicators of lodging demand. Depending on the type of service provided by a particular airfield, a sizable percentage of arriving passengers may require hotel accommodations. Trends showing changes in passenger counts also reflect local business activity and the overall economic health of the area.
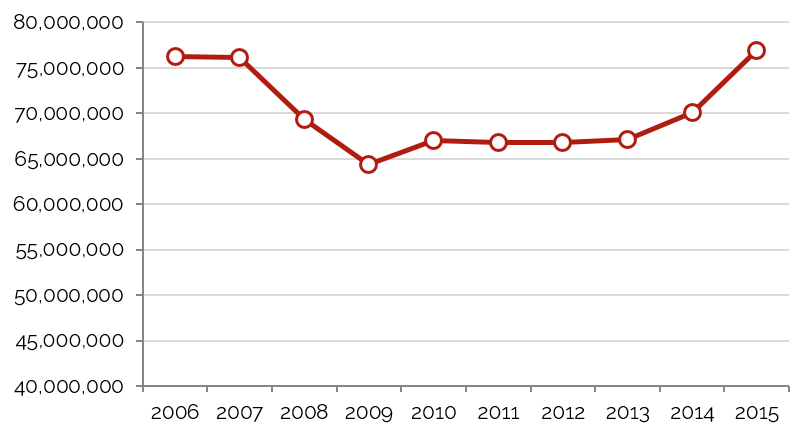
Operated by the City of Chicago Department of Aviation as a fully self-supporting facility, Chicago O’Hare International Airport (ORD) is located 17 miles northwest of the Chicago Loop. The facility, also known as "O'Hare," serves as United Airlines' largest hub and American Airlines' second-largest hub, after Dallas/Fort Worth. The O’Hare Modernization Program (OMP), which is designed to reduce delays, increase capacity, and increase the safety of the airfield, is underway. Upgrades will include the construction of multiple new runways, additional air-traffic-control towers, and other supporting projects. The $15-billion project was slated for completion in 2015; however, increasing opposition from displaced residents has led to a number of delays in the development process. According to the City of Chicago, the modernization plan is expected to contribute $18 billion to the local economy and create 195,000 jobs.
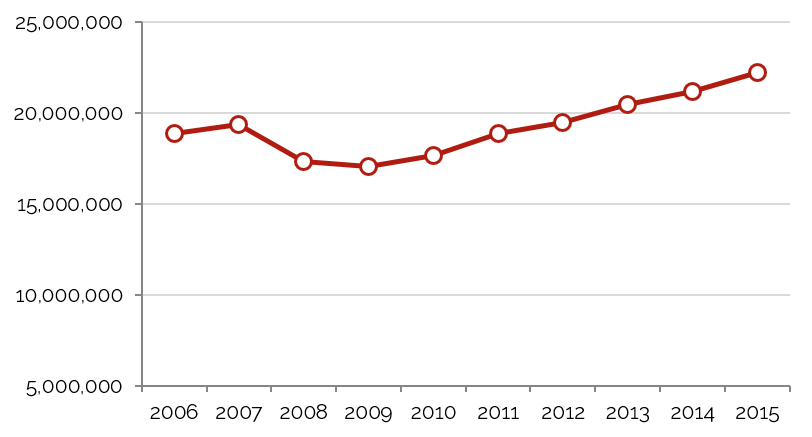
Chicago Midway International Airport’s original name was Chicago Municipal Airport. It was changed to Midway Airport in 1949 in honor of the hard-fought Battle of Midway during World War II. Midway is the nation’s premier point-to-point, low-fare airport. The Midway Airport Terminal Development Program, completed in 2004, increased the number of gates from 29 to 43. Southwest Airlines is currently the dominant carrier at Midway, controlling more than half of the airport's 43 gates; furthermore, Southwest Airlines began international service from Midway to Mexico and the Caribbean in November 2014. A new baggage-screening system was implemented in 2007, and an expansion of Concourse A was completed in the spring of 2010. In April 2013, the airport opened its new, $55-millon rental-car facility, which houses eight rental companies, as well as a quick turn-around facility where cars are fueled, washed, and prepared for rental. The rental-car facility includes many green features such as a vegetated roof, solar panels, and wind turbines, as well as shuttles that are operated by biofuels. In 2014, approximately $170 million in various capital improvement projects were completed at the airport.
Airport Continues to Rise
Airport Peaks in 2015
Source: Chicago O’Hare Airport
Tourist Attractions
Tourism to Chicago is busiest from May to September, when the city hosts a variety of outdoor concerts, festivals, sports competitions, farmer’s markets, and art shows. During other times of the year, weekend demand comprises sports fans attending various professional sporting events, people visiting friends or relatives, and other similar weekend demand generators.
Michigan Avenue, also referred to as the Magnificent Mile, is famous for its mixture of upscale department stores, restaurants, high-end retailers, and office buildings. Additionally, the 24-acre Millennium Park along Michigan Avenue opened in 2004. It offers numerous tourist attractions, including its famed 4,000-seat Pritzker Pavilion outdoor amphitheater, several outdoor sculpture gardens, an ice rink, the Cloudgate statue, the Frank Gehry-designed BP Bridge, and multiple retail shops and food and beverage establishments. In 2014, construction began on the Maggie Daley Park, a 20-acre piece of land in the northeast corner of Grant Park. The first phase opened in late 2014 and featured an ice-skating ribbon, a playground area, and a fieldhouse. The remaining portion of the $55-million park opened in the spring of 2015, including additional playgrounds and gardens, as well as a climbing park.
 Navy Pier is a 3,300-foot-long pier located along Lake Michigan. Navy Pier offers restaurants, shopping, dining cruises, boat tours, a 15-story Ferris wheel, an IMAX Theatre, the Chicago Children's Museum, and many forms of live entertainment. Coinciding with its 100th anniversary in 2016, the pier is currently undergoing a major renovation.
The Shedd Aquarium, one of the largest indoor aquariums in the world, is home to roughly 1,500 species of fish, marine mammals, birds, snakes, amphibians, and insects. Permanent exhibits include Waters of the World, Caribbean Reef, Amazon Rising, Wild Reef, Stingray Touch, and the Abbott Oceanarium. A wall of windows looking out onto Lake Michigan backs “Whale Harbor,” the Oceanarium’s 3,000,000-gallon main tank. The facility is surrounded by Museum Campus Chicago, which it shares with the Adler Planetarium and the Field Museum of Natural History.
Professional sports in Chicago include hockey, football, basketball, and two major league baseball teams. Wrigley Field, built in 1914, is home to the Chicago Cubs and is the second-oldest ballpark in the major league, behind Boston's Fenway Park. Restoration and expansion began on the park following the end of the season in 2014. The four-year plan includes improved player facilities, structural upgrades, additional seating, and fan-experience enhancements. The renovations will be complemented by a neighborhood plan to improve the facilities just outside of the park and add new entertainment, hotel, and dining venues. The United Center Arena hosts the NBA's Chicago Bulls and the NHL's Chicago Blackhawks, as well as many high-profile concerts, special events, and shows. Additionally, Soldier Field hosts the NFL’s Chicago Bears, along with various concerts and entertainment events throughout the year.
Closing Remarks
The upward swing in hotel demand has kept Chicago’s hotel industry roaring in recent years. Rooms revenue increased by more than 8% in 2015; furthermore, occupancy grew despite the supply increase. Passenger traffic to Chicago through the city’s two major airports rose by 8.7% last year. The increase in demand has allowed local hoteliers to push higher average rates, resulting in RevPAR increases that should be sustainable in the near term. These positive market indicators have a bearing on hotel values in Chicago, which are also anticipated to rise over the next two years.
At the same time, high demand has brought more interest in hotel development, and room supply in Chicago is expected to grow, particularly in Downtown Chicago. Many new hotels opened in early 2015, including the first 257-room Hyatt Centric hotel and the state’s first 226-room AC Hotel by Marriott. The first Virgin Hotel in the franchise also opened in early 2015. The supply changes will make the hotel environment more competitive, though the exact impact on average rates and overall occupancy remains to be determined. Through 2015, hoteliers continued to push rates to unprecedented heights given the strong levels of demand in the market.
HVS anticipates strong average rate growth in 2016; however, hoteliers must be wary of raising average rates too high given the amount of new supply entering the market in the next two years. To remain competitive, existing hotels will need to maintain a quality product by completing regular maintenance and brand-mandated property improvement plans, enabling them to command higher average rates while capturing a fair share of the increasing demand.