Lodging Industry Overview
Since room sales generate lodging tax revenues, an overview of hotel market trends provides a perspective on the industry's current and future fiscal impacts. While the negative impacts of the COVID-19 pandemic were unprecedented, as documented in our 2022 HVS Lodging Tax Study, nearly all lodging markets have reached or exceeded pre-COVID levels of revenue generation. Revenue per available room (“RevPAR”), the product of average daily room rate and occupancy rate, is a standard industry metric that combines the effects of occupancy and average daily room rate changes on hotel revenue performance. The figure below compares the amounts of RevPAR in the 25 US urban markets for each month from January 2019 through July 2023.
25 Major US Urban Markets—Revenue Per Available Room
.jpg)
Source: STR Global
By spring 2022, aggregate monthly RevPAR met or exceeded 2019 levels in the 25 Major US Urban Lodging Markets. Growth in RevPAR was strong in the early months of 2023 but has shown little growth over 2022 beginning in May of 2023. Most state and local governments should expect lodging tax revenue growth to slow in the second half of 2023.
To indicate the potential recovery of lodging tax revenues, we calculated RevPAR as a percentage of pre-COVID levels (the calendar year 2019) for 2020 through an estimated year-end of 2023. We estimated year-end 2023 based on year-to-date through July and assumed that the remaining months of the year would match 2022 levels. The figure below shows the percentage of recovery or RevPAR from pre-COVID levels in 2019 for the major US markets.
Top 25 US Lodging Markets Percentage Recovery of RevPAR from 2019
.jpg)
Source: STR Global
The speed and strength of recovery vary widely among major US markets. All but two markets, Minneapolis and San Francisco, have reached or exceeded 2019 levels of RevPAR. Markets such as Phoenix, San Diego, and Orlando, with high levels of tourist visitation, have shown the most strength. Leisure markets have thrived on the return of price-insensitive leisure travel. Unlike in prior downturns of the economy, the disposable income of higher-income households increased during the pandemic. Once travel restrictions were lifted, pent-up lodging demand was unleashed on the market, so-called “revenge travel.” In a class by itself, the San Francisco market has suffered from job cuts in the tech sector, the loss of group meeting business, and weak tourist demand and has only recovered three-fourths of its pre-COVID RevPAR.
Labor Force Issues
Reconstituting the labor force in the industry was a significant impediment to growth, but in 2023, the number of employees in the hospitality and leisure sector has reached pre-pandemic levels. The graph below compares the percentage change in hospitality employment with the unemployment rate.
Hospitality and Leisure Sector Employment (Total US)
.jpg)
Source: Bureau of Labor Statistics
Restoring employment levels in hotels has come at a cost. According to data from the Bureau of Labor Statistics, the average weekly earnings of all hotel and motel employees (except casino hotels) has increased by approximately 30% from June 2019 to June 2023.
Higher operating costs and unfavorable credit market conditions are slowing the addition of new room supply. With lower growth in RevPAR and limited new supply, the growth in lodging tax revenue is likely to slow in most lodging markets in 2023 and 2024.
Imposition of Lodging Taxes
Lodging taxes are typically ad valorem taxes (levied as a percentage of value) on short-term[1] overnight stays at hotels, motels, bed-and-breakfasts, and other lodging accommodations. Lodging taxes levied by state and local governments have common characteristics but bear many names, including hotel occupancy tax, hotel-motel tax, room tax, bed tax, transient occupancy tax, tourism improvement tax, and various other names. States authorize the imposition of lodging taxes, except in home rule cities.[2] States may tax lodging as a part of a general sales and use tax, a specific lodging tax, or both. For most lodging taxes, state legislation defines the tax base, determines who is exempt from the lodging tax, and establishes collection procedures. State, county, and local governments also impose lodging taxes, which may distribute tax revenues to their general, special revenue, or debt service funds. In many cities, state and municipal governments have formed special districts to levy additional lodging taxes on hotels within a defined geographic area. Different districts within a city may have varying rates of lodging taxes. Certain state and local governments also impose excise taxes on lodging at a fixed amount per unit of sale, such as a $1.00 per room night fee for furnishing a hotel room.
From a political perspective, lodging taxes may be easier to impose than other taxes because visitors who use lodging accommodations are not constituents of the local municipalities. Typically, hotel operators collect the tax from guests and receive a small administrative fee of one or two percent of collections.
While the tax's legal incidence may fall on the consumer, the economic burden of the lodging tax is shared by both providers of lodging accommodations and their guests. A lodging tax raises the price of lodging accommodations. Depending on the elasticity of the supply and demand for lodging, the hotel manager may be unable to increase its room rates enough to compensate for paying the full amount of the tax. Since the elasticity of supply and demand changes depending on market conditions, the true incidence of a lodging tax varies as market conditions change. This study does not attempt to estimate the economic incidence of lodging taxes.
Hotel owners are often willing to cooperate with local governments to impose lodging taxes dedicated to tourism promotion and convention center construction. For hotel owners, tourist-oriented public facilities and advertising serve as drivers of room demand. All hotels in a given market can benefit from programs that bring tourists and convention attendees to a city. Sponsoring these types of programs would be prohibitively expensive for any individual hotel. In the case of convention centers funded by a lodging tax, the hotels and individuals who benefit from the center pay for its construction and maintenance. Municipalities seek to benefit from visitor spending and convention centers' associated tax revenue. By imposing lodging taxes, those who benefit pay for advertising, marketing, and sales efforts funded by lodging tax revenue.
Some states, particularly those with large tourism industries, prevent municipalities from depositing hotel tax revenue into their general funds. For example, Florida allows only a series of special-purpose taxes for tourist development. Texas requires local transient occupancy taxes to fund convention center development or tourism promotion.
Since the 1970s, lodging taxes have become commonplace across the country. Of the 150 largest U.S. cities examined in this study, more than 120 impose a dedicated tax, and all collect some form of taxation on hotel room revenue. In small suburban cities and major tourist destinations, lodging taxes have become an important funding source for economic development initiatives. This study attempts to survey hotel tax implementation across the country to provide information for those wishing to compare the structure and revenue capacity of lodging taxes in diverse markets.
Revenues from Lodging Taxes
While a relatively small share of revenue for state and local governments, lodging tax revenues significantly impact the tourism economy. Lodging taxes support tourism marketing, the repayment of debt of tourism-related projects, or for general fund purposes. Most destination marketing organizations rely primarily on lodging taxes to support their operations, which were decimated during the pandemic. Lodging tax revenues are pledged to support roughly $1.3 billion in outstanding municipal debt.[3]
Before the onset of the crisis, during the fiscal year 2019, the 25 major US markets generated approximately $3.6 billion in lodging tax revenue, as shown in the figure below.
Lodging Tax Revenues in 25 U.S. Markets
.jpg)
Sources: Financial Statements of Respective Governments
In total, these markets experienced a decline in revenue to around $2.5 billion in fiscal year 2020, reflecting the pandemic's early impact. Revenue declined to around $1.5 billion in fiscal year 2021, which reflects a full year of the negative impacts of the pandemic. In fiscal year 2022, revenue increased to $2.9 billion, reflecting a full year of pandemic recovery. The 2022 data reflects a typical two-month delay between when the consumer pays the tax and when revenues are available to local governments.
Changes in Lodging Tax Rates
State, county, and local governments passed into law several rate changes that took effect during or immediately following fiscal year 2022. Recent changes in lodging taxes in cities are provided in the following table.
Recent Changes in Tax Rates
.jpg)
Source: Respective Jurisdictions
In addition to the recent state and local rate changes, HVS projects the following changes for fiscal year 2023 and beyond.
Projected Changes for Fiscal Year 2023
.jpg)
Source: Respective Jurisdictions
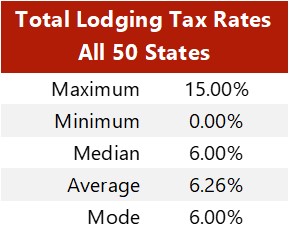
State Tax Rates
All but two states impose a sales tax, a lodging tax, or both on overnight transient accommodations. Municipal governments impose lodging taxes in two states (Alaska and California) that do not tax hotel lodging. Twenty-five states impose lodging taxes that are not part of a broader sales or use tax. The table on the following page lists the sales tax, lodging tax, and total tax rate levied on lodging accommodations. It ranks the 50 states by the total tax rate applied to lodging.
States with high lodging tax rates typically have more restrictions on imposing local lodging taxes. To illustrate, Connecticut has the highest statewide lodging tax rate at 15% but forbids all local authorities from imposing additional lodging taxes. On the other hand, Oregon imposes a low state lodging rate but does not restrict local taxes.
Source: Respective Jurisdictions
Appendix A presents a detailed description of each state’s lodging taxes and annual revenue collections.
State Lodging and Sales Taxes Imposed on Hotels
Source: HVS and Respective Jurisdictions
States Ranked by Total Ad Valorem Tax Rates on Lodging Accommodations 2022
.jpg)
Source: Respective Jurisdictions
State Lodging Tax Revenue
HVS analyzed annual state lodging tax revenues as stated in comprehensive annual financial reports, most of which report revenues on a modified accrual basis. In a few states where the final audited information was unavailable for fiscal year 2022, HVS recorded government estimates from budget reports. Government agencies sometimes provide annual lodging tax collection data instead of modified accrual data. Accrued revenues are recorded in the period in which the liability for tax payment occurs. Cash collections typically lag the period of liability by at least one month.
Depending on the size of their tax liabilities, taxpayers may remit payments monthly, quarterly, or annually.
Administrative charges, payment of back taxes, and penalties may also affect the reported revenues, but the amounts are small. Only sales tax revenues in the accommodations sector were available in some states. Whereas lodging taxes are typically applied only to hotel room charges, sector-wide taxable sales might include other sources of taxable revenue, such as food and beverage revenue. We did not attempt to estimate the percentage of taxable sales due solely to overnight stays.
Among the states that collect a lodging or sales tax on hotel rooms, total revenue increased by an average of 89% from 2021. In previous years, lodging tax revenues had steadily declined. This overall decline was largely—if not entirely—attributable to the slowdown of transient and business travel during the COVID-19 pandemic. 2022’s large increase signifies an initial full year of recovery nationwide.
Of those states that collected a lodging tax and reported revenues in 2022, each reported increases in lodging tax revenues in 2022 compared to 2021. Hawaii reported the largest increase in revenue at 240.8% year-over-year.
The following table presents a six-year history of lodging tax revenue for each of the twenty-two states that have imposed a dedicated lodging tax. Revenue reported from past years has been adjusted for inflation. Data is presented in millions of dollars, and the states are ranked by 2022 revenues.
Rank of States by 2022 Lodging Tax Revenues (millions)
.jpg)
Source: Respective Jurisdictions
Total Lodging Tax Rates
HVS researched the total tax rate applied to lodging accommodations in the 150 most populous United States cities as projected from the 2010 census. The total tax rate comprises all state, county, city, and special district taxes levied on lodging facilities within the city's urban center, where the highest special district taxes may be applied. The following tables list the tax rate applied to overnight stays at lodging facilities at the state, county, city, and special district levels, as well as the total rate imposed on an overnight stay at a lodging facility in the urban center of each of the 150 largest cities in the United States.
.jpg)
Source: Respective Jurisdictions
To calculate the special district rate, HVS calculated the tax rate an overnight visitor would pay to stay at the hotel with the highest tax rate within a special taxing district. Due to special taxing districts, the tax rate at a particular hotel can be influenced by its location, size, or other factors that determine tax rates.
The figure below shows a distribution of combined lodging tax rates in the 150 largest U.S. cities.
Frequency of Total Lodging Tax Rates
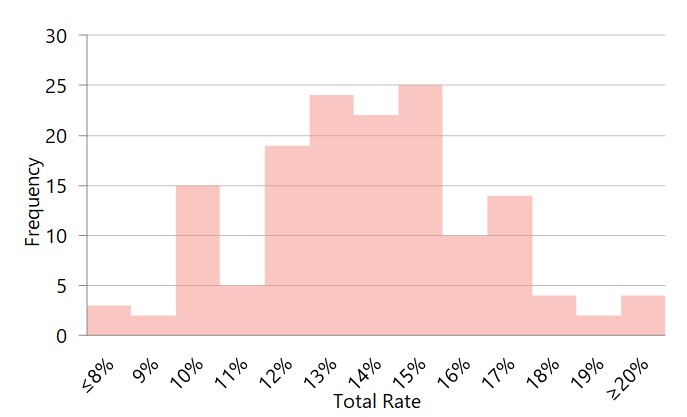
Source: HVS and Respective Jurisdictions
The table on the following page ranks 150 cities by total lodging tax rate. This enables a comparison of the cities and provides a breakdown of tax rates by government unit.
Top 150 Urban Centers Total Lodging Tax Rate Ranking 2022
![]()
.jpg)
Source: Respective Jurisdictions
Tax Rates in Top 150 Urban Centers 2022
.jpg)
Source: Respective Jurisdictions
Tax Rates in Top 150 Urban Centers 2022 - Continued
.jpg)
Source: Respective Jurisdictions
Tax Rates in Top 150 Urban Centers 2022 - Continued
.jpg)
Source: Respective Jurisdictions
City Lodging Tax Revenue
The following tables describe the lodging tax revenue that the 150 most populous cities collected from lodging taxes. Unless otherwise noted, the tax rate and revenue listed only pertains to the citywide lodging tax and excludes special district or city sales taxes. Consequently, the revenue figures presented for comparable cities can diverge greatly. For example, a city in California with an average lodging tax rate will show greater revenue year over year than a similar city in Nevada, where taxes are levied primarily at the state and special district level. For individual cities, revenues are reported from consistent sources each year.
In some states and cities, lodging taxes are imposed by the county rather than city level. For example, cities in Florida, Indiana, and parts of New York do not levy municipal lodging taxes. In such cases, we list county lodging tax revenues. Year-over-year revenue changes may reflect tax rate changes and underlying changes in taxable receipts for lodging.
Reported Lodging Tax Revenues in Top 150 Urban Centers ($ Millions)
.jpg)
Source: Respective Jurisdictions
Reported Lodging Tax Revenues in Top 150 Urban Centers ($ Millions) - Continued
.jpg)
Source: Respective Jurisdictions
Reported Lodging Tax Revenues in Top 150 Urban Centers ($ Millions)- Continued
.jpg)
Source: Respective Jurisdictions
Excise Taxes
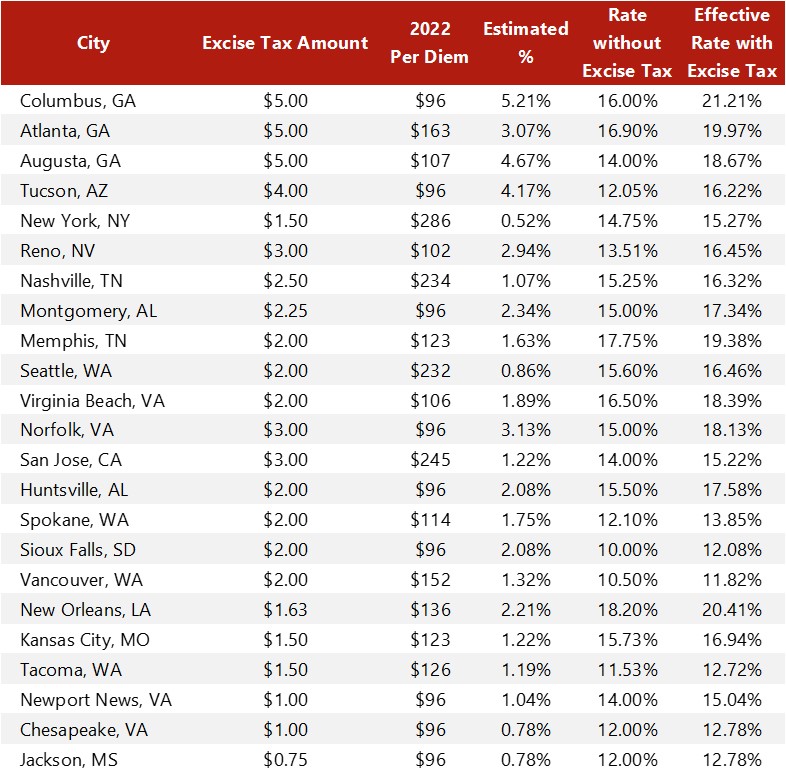
In addition to percentage taxes on gross room revenues, some hotels are subject to excise taxes on lodging transactions and may be charged a flat fee per room night. Excise taxes tend to be less volatile because they only depend on occupancy and are not subject to room price variations. However, excise taxes do not grow with inflation or room rate increases.
Hotels in 24 cities are subject to a state, city-wide, or special district excise tax. Excise taxes range from $0.75 to $5.00 per room night, with an average of $2.50. HVS calculated each city’s excise tax as a percentage of its per diem rate (in fiscal year 2022 dollars) to estimate effective tax rates. A city’s effective rate indicates the average rate a person pays if the excise tax were included as a percentage of the total sale price. For this example, HVS used the per diem rates set by the General Services Administration (GSA). The per diem rates set by the GSA are usually lower than the average daily rates at hotels in the specified areas. The chart below is for illustrative purposes only.
On average, every dollar charged in excise tax is roughly equivalent to an ad valorem tax increase of 2.09% for 2022.
Selected Effective Rates of Excise Taxes
Source: HVS, GSA, and Respective Jurisdictions
Airbnb Lodging Tax Collections
Short-term home rental services such as Airbnb and VRBO have grown popular among travelers, with Airbnb being the dominant player in the market. 2022 marked a record year in terms of revenue for Airbnb, with a total of $8.4 billion, an increase of 40% from 2021. Often called parts of a sharing economy, these peer-to-peer platforms allow homeowners or hosts to rent out a spare room or an entire house or apartment to travelers seeking unique travel experiences and accommodations. Airbnb has exponentially grown since its founding. In February 2023, Airbnb reported an increase of over 900,000 listings, resulting in 6.6 million global active listings.
In reaction to Airbnb’s growth, cities have been forced to confront challenges related to the impact of short-term rentals. Residents have raised concerns over the neighborhood impacts of transient visitation. In response, many cities and states have imposed new taxes and regulations on short-term rentals.
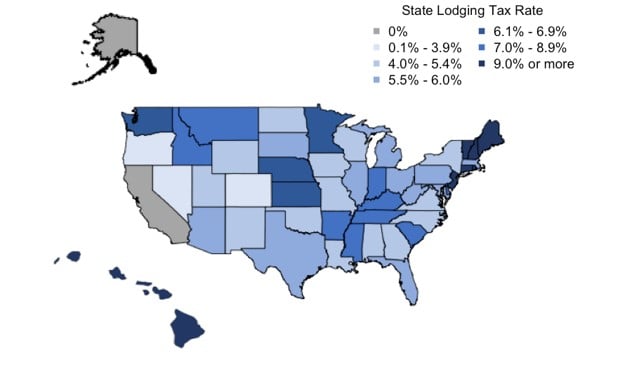
To gain legitimacy and permanence within the United States, Airbnb has urged local governments to allow it to collect and remit lodging taxes on its hosts’ behalf. In the past two years, states and cities have made considerable efforts to collect taxes from Airbnb. The map below shows where Airbnb collects local lodging taxes, state taxes, or a combination.
Airbnb Lodging Tax Collection by State
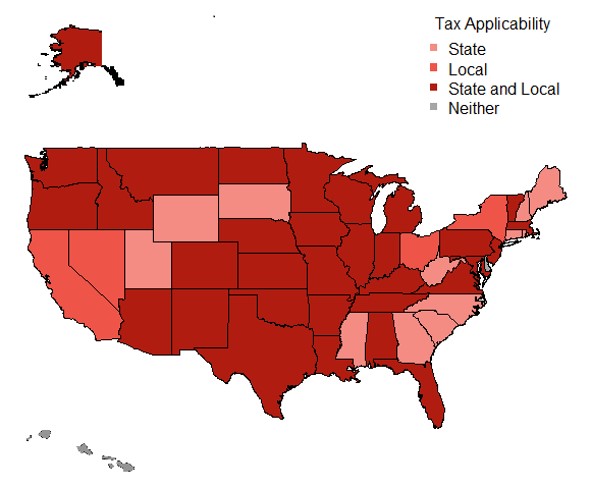
Source: HVS and Airbnb
Disclaimer
HVS’s lodging tax study recognizes that lodging tax rates, collections, and distributions are in constant flux. The data presented herein are HVS’s best attempt to gather the most recently available information. HVS used sources deemed to be reliable and assumes that this information is accurate. All questions, comments, or concerns are welcome in the continuing process to accurately present the current and historical trends of lodging taxes in the United States.
[1]Typically defined in ordinances as being fewer than thirty days.
[2]Home rule cities are cities that have their own taxing authority, have adopted home rule charter for their self-governance, and are not limited to exercising only those powers that the state expressly grants to them.
[3]Hazinski and Marlow, Local Lodging Taxes During and After the Pandemic, Municipal Finance Journal, Spring 2023, Vol. 44, No. 1.