Market Report

How the 2026 FIFA World Cup Changed US Hotel Markets

August 6, 2026
To measure the impact of the FIFA World Cup in eleven U.S. cities, we compare occupancy rates, ADR, RevPAR, and rooms revenue during the weeks of World Cup matches to the same weeks in 2025, as adjusted for the expected change in these variables in the absence of the FIFA events. We demonstrate a wide variance in the impact in host cities and discuss the underlying factors that influence these differences.

Introduction

The 2026 FIFA World Cup represents one of the largest and most geographically concentrated demand events in the history of U.S. hospitality, with matches held in eleven American cities over a roughly six-week span. Events of this scale offer a valuable, if infrequent, opportunity to study how a hotel market absorbs a sudden, temporary surge in demand, and to understand why some markets capture outsized rates and occupancy gains while others see comparatively modest impact.
 
Source: iStock

Methodology

For each of the eleven host cities, we compare actual occupancy, average daily room rates (“ADR”), revenue per available room (“RevPAR”), and rooms revenue during the weeks in which World Cup matches were played against a counterfactual scenario, our estimate of what these metrics would have been in 2026 had the World Cup not occurred. Constructing this baseline is essential to isolating the World Cup's effect from other forces already at work in each market. Simply comparing 2026 match-week performance to the same weeks in 2025 would conflate the tournament's impact with whatever growth or decline the market was already experiencing. Our counterfactual approach adjusts 2025’s performance for each market's underlying trend before making that comparison, so that the resulting difference reflects the World Cup's effect.

Applying this approach across all eleven markets reveals a wide variance in impact. Some cities saw substantial gains in occupancy and ADR during match weeks, while others experienced far more limited effects, and in certain cases little effect at all. The remainder of this report presents those results city by city and examines the underlying factors: market size and performance, the number of matches hosted, venue location, and the size of each team's traveling fan base. These factors help explain why the tournament's impact differed so markedly from one host city to the next.

The analysis period for each city runs from three days before its first match to three days after its last. Since cities hosted multiple matches in succession, these three-day windows overlap.

Market Definitions

For each of the eleven markets, we compiled data on available room night supply, room night demand, and rooms revenue relying on CoStar data. Market boundaries were drawn to capture both hotels directly affected by fan visitation and hotels indirectly affected through the compression of rate and occupancy that displaces demand outward to surrounding properties.

Our experience analyzing the lodging impacts of major events has shown that these effects are wide-ranging.[1] Compression of occupancy and ADR is greatest at hotels closest to the event site and diminishes with distance. As nearby hotels fill and their rates rise, demand is displaced to more distant properties, producing a secondary compression effect that also tapers off with distance from the venue. In practice, we have found that the impact summed across submarkets is roughly equivalent to the impact that would be found across the entire lodging market. Because of this, we defined our study markets broadly enough to capture the full extent of the compression effect rather than limiting the analysis to hotels in the immediate vicinity of each venue.

For seven of the markets (Kansas City, Los Angeles, Dallas, Houston, Philadelphia, Seattle, and Atlanta), we relied on the respective CoStar-defined hospitality markets, which we judged to adequately capture the affected hotel supply. In the remaining four markets (New York, Boston, San Francisco, and Miami), the CoStar market definitions did not adequately reflect the full range of hotels subject to direct and indirect impacts, so we drew custom boundaries around the hotels affected by World Cup matches:
 
  • San Francisco — Santa Clara (the location of the matches), San Jose, San Francisco, and the hotels in between along the peninsula.
  • New York — all five New York City boroughs plus Newark.
  • Boston — hotels along the I-95 corridor, including Providence and Foxborough, in addition to Boston itself.
  • Miami — Miami, Fort Lauderdale, Key Biscayne, Hialeah, and Hollywood.
Defining the precise boundary of compression in any market involves an element of judgment. We believe the market definitions above provide an accurate representation of the hotels directly and indirectly affected by World Cup matches in each city.

Estimating the Counterfactual Scenario

To construct the counterfactual scenario for each market, we first examined occupancy, ADR, and RevPAR performance from January through May of 2025 and 2026, and calculated the year-over-year rate of change, whether growth or decline, in each metric over that period. We then applied this year-to-date growth rate to each market's actual 2025 performance during the World Cup match weeks. This produced an adjusted 2025 baseline that represents our estimate of how each market would have performed in 2026 absent the World Cup.

We then compared this adjusted baseline to each market's actual 2026 performance during the corresponding match weeks. The difference between the two, adjusted (counterfactual) performance versus actual performance, represents our estimate of the World Cup's impact in each market.

Results

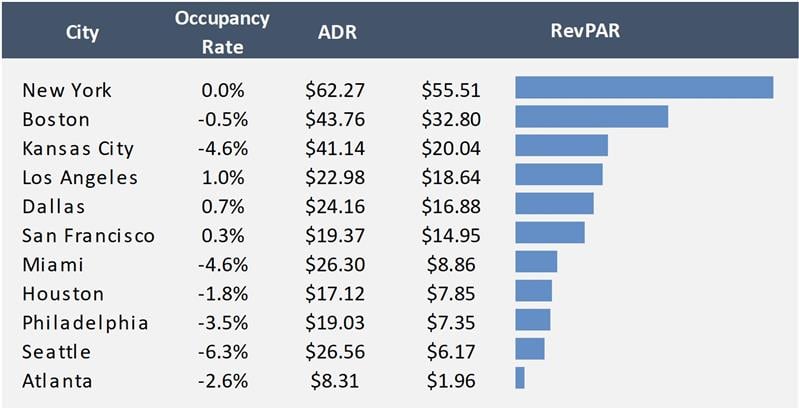
The figure below shows the estimated change in occupancy rates, ADR, and RevPAR during the roughly six-week periods of World Cup matches.

Estimated Changes in Occupancy Rate, ADR and RevPAR
Sources: CoStar data and HVS Analysis

The analysis reveals a consistent pattern across nearly every host city: occupancy softened during World Cup match weeks relative to the counterfactual baseline, while ADR rose sharply enough to produce a RevPAR gain in all eleven markets. This pattern reflects the dynamic pricing practices hotels employed in anticipation of World Cup demand, practices that in most markets generated significant rate gains but also destroyed a meaningful share of the demand the market would otherwise have hosted.

Occupancy declined relative to the counterfactual baseline in seven of the eleven markets studied. The declines ranged from a steep 6.3 percentage-point drop in Seattle to a comparatively modest 0.5 percentage-point decline in Boston, with Kansas City and Miami each down 4.6 points, Philadelphia down 3.5 points, Atlanta down 2.6 points, and Houston down 1.8 points. Only three markets — Los Angeles (+1.0 points), Dallas (+0.7 points), and San Francisco (+0.3 points) — saw occupancy rise above the counterfactual baseline during match weeks, and New York's occupancy was essentially unchanged.

ADR, by contrast, increased in every one of the eleven markets and by a considerable margin in most cases. Gains ranged from $8.31 in Atlanta to $62.27 in New York, with Boston ($43.76), Kansas City ($41.14), Seattle ($26.56), and Miami ($26.30) all posting increases of more than $25.

The combination of rising rates and falling occupancy in most markets is consistent with demand destruction driven by aggressive dynamic pricing. As hotels raised rates in anticipation of World Cup visitation, individual business and leisure travelers who would ordinarily have booked those markets during those weeks were priced out and either shifted their travel dates, chose alternative destinations, or forwent the trip altogether. Group and meeting business was affected as well, and in many cases more severely: because group room blocks are typically negotiated and contracted well in advance, at rates set long before hotels moved to event-period dynamic pricing, planners responded by postponing their events to a later date or relocating them to markets unaffected by World Cup-driven rate spikes. The net effect was a meaningful loss of both transient and group room nights in most host cities during the weeks of World Cup matches.

Because ADR gains outweighed this occupancy softness in every market, RevPAR still rose across the board, though the magnitude of that increase varied enormously from city to city. New York's RevPAR gain of $55.51 was the largest by a wide margin, nearly 70% greater than the second-highest gain, in Boston ($32.80), and more than 28 times the smallest RevPAR gain recorded, in Atlanta ($1.96). Kansas City and Los Angeles rounded out the top four, with RevPAR gains of $20.04 and $18.64 respectively, while the remaining seven markets — Dallas, San Francisco, Miami, Houston, Philadelphia, Seattle, and Atlanta each posted RevPAR gains below $17.

These results point to a clear finding: the primary channel through which the World Cup lifted hotel performance in these eleven markets were through price increases rather than occupancy. ADR lift came at a cost. In most host cities, dynamic pricing during match weeks priced out price-sensitive transient demand and displaced group and meeting business to other periods or other markets, leaving occupancy below the counterfactual baseline.

RevPAR Impact in Percentage Terms

While the RevPAR impact figures discussed above indicate which markets captured the largest absolute revenue gain during World Cup match weeks, they do not by themselves indicate which markets were most effective at optimizing pricing relative to their normal rate environment. A market with a naturally high baseline RevPAR can post a large dollar gain while achieving only a modest relative lift, while a market with a lower baseline RevPAR can post a much smaller dollar gain that nonetheless represents a substantially larger proportional increase. Measuring the impact as a percentage change from the counterfactual baseline corrects for this difference in scale and offers a clearer read on which markets' hotels were most successful at optimizing revenue during the tournament.

Percent Change in RevPAR during Match Weeks
Sources: CoStar data and HVS Analysis

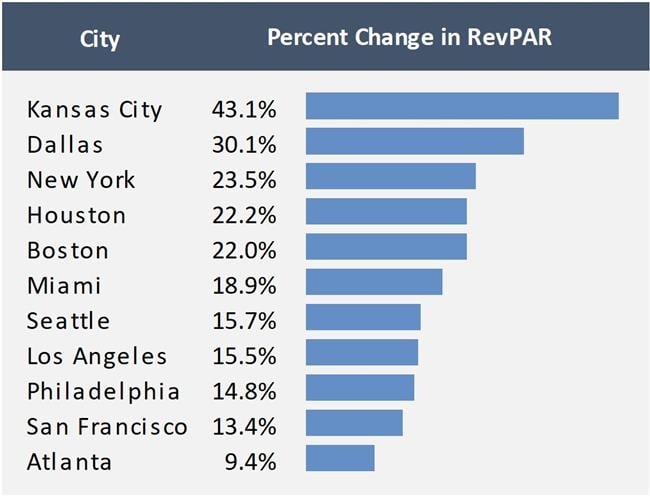
Viewed from this perspective, the ranking of markets shifts considerably. Kansas City, which ranked third in dollar RevPAR gain, recorded the largest percentage increase of any market by a wide margin, at 43.1%. Dallas followed at 30.1%, moving up from fifth in dollar terms to second on a percentage basis. New York remained near the top of the ranking at 23.5%, confirming that its performance was exceptional in both absolute and relative terms.

Houston and Boston posted nearly identical percentage gains, at 22.2% and 22.0% respectively, even though Boston's dollar RevPAR gain ($32.80) was more than four times the size of Houston's ($7.85). Houston's comparatively low baseline RevPAR meant that its smaller dollar gains still represented a relative pricing lift on par with Boston's much larger dollar gain. Miami rounded out the upper half of the ranking at 18.9%.

The lower half of the percentage ranking includes several markets that ranked considerably higher on a dollar basis. Los Angeles, which posted the fourth-largest dollar RevPAR gain, fell to eighth in percentage terms at 15.5%, and San Francisco fell from sixth in dollar terms to tenth on a percentage basis at 13.4%. In both cases, a relatively high baseline RevPAR meant that a meaningful dollar gain translated into a comparatively modest relative increase. Seattle shows the opposite pattern: despite posting the second smallest dollar RevPAR gain in the study, its low baseline RevPAR meant that gain translated into a 15.7% increase, moving it up from tenth to seventh in the percentage ranking. Philadelphia held roughly steady across both measures, at 14.8%. Atlanta again ranked last, at 9.4%, though even this smallest percentage increase represents a meaningful relative gain and confirms that every one of the eleven host markets experienced a positive pricing effect from the World Cup.

The percentage-change view indicates that the markets most successful at optimizing pricing during World Cup match weeks were not necessarily the largest gateway markets or those with the highest baseline rates. Kansas City and Dallas, both comparatively lower-rate markets, achieved the greatest relative pricing lift of the eleven cities studied, while some higher-rate markets, such as Los Angeles and San Francisco, generated large dollar gains but comparatively modest relative price increases. We discuss the market-specific factors likely to drive these differences later in this report.

Rooms Revenue Impact by Market

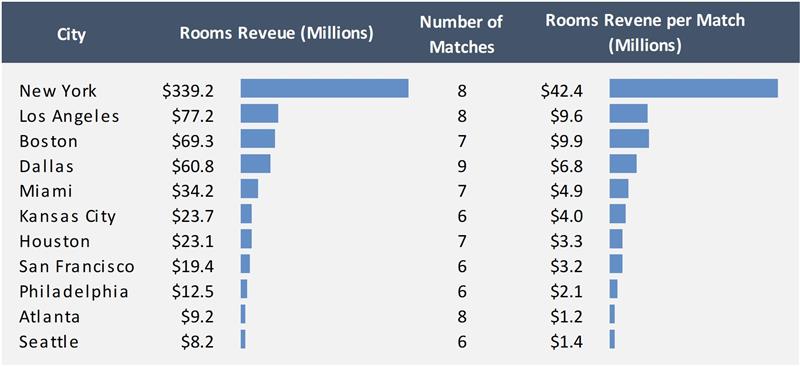
Across the eleven host cities, the World Cup generated an estimated $680 million in incremental rooms revenue during match weeks. New York alone accounted for roughly half of the total, at $339.2 million, reflecting both its status as by far the largest hotel market of the eleven and the fact that it hosted eight matches. Los Angeles ($77.2 million) and Boston ($69.3 million) formed a clear second tier, followed by Dallas ($60.8 million) and Miami ($34.2 million). The remaining six markets — Kansas City, Houston, San Francisco, Philadelphia, Atlanta, and Seattle — each generated less than $25 million, ranging from $23.7 million down to $8.2 million.

Room Revenue Changes during Match Weeks
Sources: CoStar data and HVS Analysis

The number of matches a city hosted was one of the drivers of total revenue impact. Each match created a discrete window of compressed demand and elevated rates, so markets hosting more matches generally had more opportunities to accumulate incremental revenue. Dallas, which hosted nine matches, the most of any market, and Boston, Miami, and Houston, each with seven, all rank among the stronger revenue producers, consistent with match count contributing meaningfully to total impact.

At the same time, match count alone does not fully explain the revenue outcome, and the rooms-revenue-per-match figures make this clear. New York and Atlanta each hosted eight matches, yet New York's per-match revenue impact ($42.4 million) was more than 30 times Atlanta's ($1.2 million), and its total impact was more than 35 times larger. As a gateway city for European travelers, New York may have benefited from increased international visitation from travelers extending their trips to matches in other cities.

Baseline Occupancy as a Predictor of ADR Gains

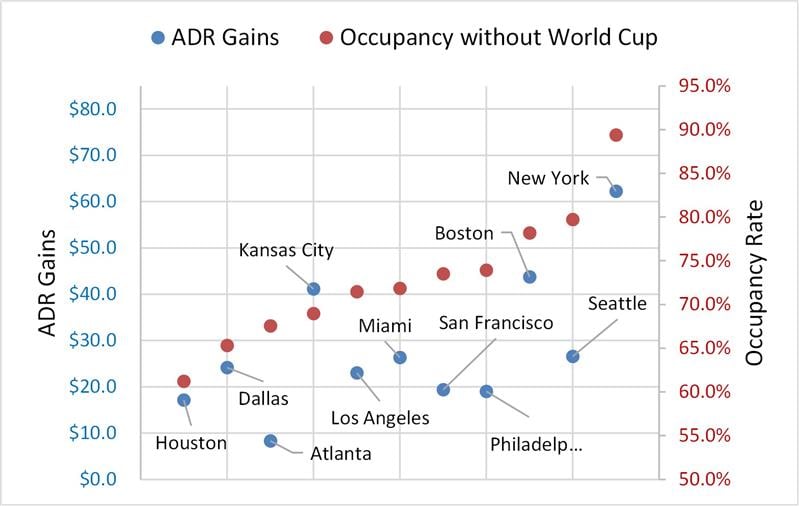
Among the variables examined in this analysis, the occupancy rates that each market would have achieved absent the World Cup (the counterfactual occupancy rate) show the strongest relationship to the size of the ADR gain a market ultimately captured. Across the eleven host cities, markets that would ordinarily have run at high occupancy captured the largest ADR gains, while markets with more spare capacity in a typical year captured comparatively smaller gains, as illustrated in the figure below.

ADR Gains Versus Occupancy Rate
Sources: CoStar data and HVS Analysis

New York illustrates this relationship most clearly. Its counterfactual occupancy of 89.4%, by a wide margin the highest of the eleven markets, was paired with the largest ADR gain in the study, at $62.3. Boston, with the second-highest counterfactual occupancy at 78.2%, produced the second-largest RevPAR gain, at $43.8. At the other end of the range, Houston's counterfactual occupancy of 61.2%, the lowest of the eleven markets, corresponded with one of the smaller ADR gains, at $17.1.

The relationship holds broadly across the middle of the distribution as well: Los Angeles, Miami, and San Francisco all cluster in the low-to-mid 70% range for counterfactual occupancy, and most produced ADR gains in a comparatively narrow band. This pattern is consistent with how compression works in a hotel market. A market that already operates near capacity in a normal year has little spare inventory to absorb incremental event-driven demand, so that demand is forced almost entirely into rate, producing a large ADR gain. A market with more room to spare can absorb a portion of that demand within its existing capacity and has less leverage to increase room rates. As shown in prior research[2], the relationship between ADR and occupancy is non-linear as the ability to increase rate grows more rapidly as occupancy increases.

Baseline occupancy alone, however, does not fully explain the results, and the markets that deviate most from what their occupancy rate would predict share a common geographic characteristic: the physical relationship between the match venue and the city's core cluster of large hotels and convention center. In Seattle, Philadelphia, and Atlanta, the stadium hosting World Cup matches sits close to, or within the same district, as the primary convention hotel cluster. In these markets, World Cup demand displaced hotel groups and convention events that would have used the pool of large hotels. Event planners either postponed or relocated their events to other markets. This offset a meaningful share of the rate gains generated by World Cup visitation. As a result, all three markets underperformed relative to what their counterfactual occupancy rate alone would predict: Seattle's high baseline occupancy (79.7%, second-highest of the eleven markets) would suggest a RevPAR gain closer to Boston's, yet it produced only $26.6; Philadelphia's baseline occupancy of 73.9% placed it in the upper half of the study, yet its $19.0 gain ranked near the bottom; and Atlanta, with Mercedes-Benz Stadium adjacent to the Georgia World Congress Center, produced the smallest ADR gain of any market, $8.3, despite a mid-range baseline occupancy of 67.6%.

New York, Boston, and Kansas City show the opposite pattern. In each of these markets, the match venue is located at some distance from the primary concentration of large hotels and convention center, which allowed World Cup-related transient demand to be absorbed largely independently of the market's existing group and convention business, without displacing it to the same degree. Because that group and convention base remained largely intact even as World Cup demand pushed rates upward, these markets captured a fuller share of the potential rate gain. This effect is most visible in Kansas City, which produced the third-largest RevPAR gain in the study, $41.1, despite ranking eighth of eleven markets in baseline occupancy, a baseline occupancy alone would not predict, but which is consistent with the venue's distance from the market's core hotel and convention cluster.

Influence of Team Composition

The size of each participating country's fan base, and that fan base's disposable income and ability to travel internationally, likely contributed to differences in room night demand across the eleven markets. Countries with smaller populations and more limited disposable income and travel capacity, including Haiti, Iran, Jordan, Cabo Verde, Senegal, Côte d'Ivoire, and Curaçao, generated comparatively fewer room nights from traveling fans. By contrast, teams from larger, wealthier countries with strong travel propensity, such as France, England, and Spain, drew significantly more visiting fans, as did Latin American teams with especially large and devoted fan followings, such as Brazil and Argentina.

Conclusion

This analysis demonstrates that the 2026 FIFA World Cup generated a substantial but highly uneven impact on hotel performance across its eleven U.S. host markets, producing an estimated $680 million in incremental rooms revenue overall. Rather than translating primarily into higher occupancy, the tournament's effect was felt mainly through rate. Dynamic pricing during match weeks pushed ADR higher in every market, even as occupancy declined in most of them as price-sensitive individual travelers were priced out and group and convention business was postponed or displaced to other markets. The magnitude of each market's RevPAR gain was shaped by several interacting factors: a market's baseline occupancy level heading into the tournament, the number of matches it hosted, the proximity of the match venue to its core cluster of convention hotels, and the size and travel propensity of the fan bases of the specific national teams playing there. New York, Boston, and Kansas City stand out as the markets that captured the fullest benefit of the tournament, while Atlanta, Seattle, and Philadelphia illustrate how proximity between the event venue and a market’s convention hotel base can constrain the net gain by displacing existing group demand. These findings suggest that a market's ability to capture value from a major international sporting event depends less on simply hosting matches than on the underlying structure of its hotel supply, its existing occupancy levels, and the degree to which event-driven demand competes with, rather than complements, the market's existing business base.

[1] HVS, ""How Convention Centers Change Hotel Markets." Retrieved June 1, 2026,

[2] IBID

Market Report

How the 2026 FIFA World Cup Changed US Hotel Markets

August 6, 2026
To measure the impact of the FIFA World Cup in eleven U.S. cities, we compare occupancy rates, ADR, RevPAR, and rooms revenue during the weeks of World Cup matches to the same weeks in 2025, as adjusted for the expected change in these variables in the absence of the FIFA events. We demonstrate a wide variance in the impact in host cities and discuss the underlying factors that influence these differences.

Introduction

The 2026 FIFA World Cup represents one of the largest and most geographically concentrated demand events in the history of U.S. hospitality, with matches held in eleven American cities over a roughly six-week span. Events of this scale offer a valuable, if infrequent, opportunity to study how a hotel market absorbs a sudden, temporary surge in demand, and to understand why some markets capture outsized rates and occupancy gains while others see comparatively modest impact.
 
Source: iStock

Methodology

For each of the eleven host cities, we compare actual occupancy, average daily room rates (“ADR”), revenue per available room (“RevPAR”), and rooms revenue during the weeks in which World Cup matches were played against a counterfactual scenario, our estimate of what these metrics would have been in 2026 had the World Cup not occurred. Constructing this baseline is essential to isolating the World Cup's effect from other forces already at work in each market. Simply comparing 2026 match-week performance to the same weeks in 2025 would conflate the tournament's impact with whatever growth or decline the market was already experiencing. Our counterfactual approach adjusts 2025’s performance for each market's underlying trend before making that comparison, so that the resulting difference reflects the World Cup's effect.

Applying this approach across all eleven markets reveals a wide variance in impact. Some cities saw substantial gains in occupancy and ADR during match weeks, while others experienced far more limited effects, and in certain cases little effect at all. The remainder of this report presents those results city by city and examines the underlying factors: market size and performance, the number of matches hosted, venue location, and the size of each team's traveling fan base. These factors help explain why the tournament's impact differed so markedly from one host city to the next.

The analysis period for each city runs from three days before its first match to three days after its last. Since cities hosted multiple matches in succession, these three-day windows overlap.

Market Definitions

For each of the eleven markets, we compiled data on available room night supply, room night demand, and rooms revenue relying on CoStar data. Market boundaries were drawn to capture both hotels directly affected by fan visitation and hotels indirectly affected through the compression of rate and occupancy that displaces demand outward to surrounding properties.

Our experience analyzing the lodging impacts of major events has shown that these effects are wide-ranging.[1] Compression of occupancy and ADR is greatest at hotels closest to the event site and diminishes with distance. As nearby hotels fill and their rates rise, demand is displaced to more distant properties, producing a secondary compression effect that also tapers off with distance from the venue. In practice, we have found that the impact summed across submarkets is roughly equivalent to the impact that would be found across the entire lodging market. Because of this, we defined our study markets broadly enough to capture the full extent of the compression effect rather than limiting the analysis to hotels in the immediate vicinity of each venue.

For seven of the markets (Kansas City, Los Angeles, Dallas, Houston, Philadelphia, Seattle, and Atlanta), we relied on the respective CoStar-defined hospitality markets, which we judged to adequately capture the affected hotel supply. In the remaining four markets (New York, Boston, San Francisco, and Miami), the CoStar market definitions did not adequately reflect the full range of hotels subject to direct and indirect impacts, so we drew custom boundaries around the hotels affected by World Cup matches:
 
  • San Francisco — Santa Clara (the location of the matches), San Jose, San Francisco, and the hotels in between along the peninsula.
  • New York — all five New York City boroughs plus Newark.
  • Boston — hotels along the I-95 corridor, including Providence and Foxborough, in addition to Boston itself.
  • Miami — Miami, Fort Lauderdale, Key Biscayne, Hialeah, and Hollywood.
Defining the precise boundary of compression in any market involves an element of judgment. We believe the market definitions above provide an accurate representation of the hotels directly and indirectly affected by World Cup matches in each city.

Estimating the Counterfactual Scenario

To construct the counterfactual scenario for each market, we first examined occupancy, ADR, and RevPAR performance from January through May of 2025 and 2026, and calculated the year-over-year rate of change, whether growth or decline, in each metric over that period. We then applied this year-to-date growth rate to each market's actual 2025 performance during the World Cup match weeks. This produced an adjusted 2025 baseline that represents our estimate of how each market would have performed in 2026 absent the World Cup.

We then compared this adjusted baseline to each market's actual 2026 performance during the corresponding match weeks. The difference between the two, adjusted (counterfactual) performance versus actual performance, represents our estimate of the World Cup's impact in each market.

Results

The figure below shows the estimated change in occupancy rates, ADR, and RevPAR during the roughly six-week periods of World Cup matches.

Estimated Changes in Occupancy Rate, ADR and RevPAR
Sources: CoStar data and HVS Analysis

The analysis reveals a consistent pattern across nearly every host city: occupancy softened during World Cup match weeks relative to the counterfactual baseline, while ADR rose sharply enough to produce a RevPAR gain in all eleven markets. This pattern reflects the dynamic pricing practices hotels employed in anticipation of World Cup demand, practices that in most markets generated significant rate gains but also destroyed a meaningful share of the demand the market would otherwise have hosted.

Occupancy declined relative to the counterfactual baseline in seven of the eleven markets studied. The declines ranged from a steep 6.3 percentage-point drop in Seattle to a comparatively modest 0.5 percentage-point decline in Boston, with Kansas City and Miami each down 4.6 points, Philadelphia down 3.5 points, Atlanta down 2.6 points, and Houston down 1.8 points. Only three markets — Los Angeles (+1.0 points), Dallas (+0.7 points), and San Francisco (+0.3 points) — saw occupancy rise above the counterfactual baseline during match weeks, and New York's occupancy was essentially unchanged.

ADR, by contrast, increased in every one of the eleven markets and by a considerable margin in most cases. Gains ranged from $8.31 in Atlanta to $62.27 in New York, with Boston ($43.76), Kansas City ($41.14), Seattle ($26.56), and Miami ($26.30) all posting increases of more than $25.

The combination of rising rates and falling occupancy in most markets is consistent with demand destruction driven by aggressive dynamic pricing. As hotels raised rates in anticipation of World Cup visitation, individual business and leisure travelers who would ordinarily have booked those markets during those weeks were priced out and either shifted their travel dates, chose alternative destinations, or forwent the trip altogether. Group and meeting business was affected as well, and in many cases more severely: because group room blocks are typically negotiated and contracted well in advance, at rates set long before hotels moved to event-period dynamic pricing, planners responded by postponing their events to a later date or relocating them to markets unaffected by World Cup-driven rate spikes. The net effect was a meaningful loss of both transient and group room nights in most host cities during the weeks of World Cup matches.

Because ADR gains outweighed this occupancy softness in every market, RevPAR still rose across the board, though the magnitude of that increase varied enormously from city to city. New York's RevPAR gain of $55.51 was the largest by a wide margin, nearly 70% greater than the second-highest gain, in Boston ($32.80), and more than 28 times the smallest RevPAR gain recorded, in Atlanta ($1.96). Kansas City and Los Angeles rounded out the top four, with RevPAR gains of $20.04 and $18.64 respectively, while the remaining seven markets — Dallas, San Francisco, Miami, Houston, Philadelphia, Seattle, and Atlanta each posted RevPAR gains below $17.

These results point to a clear finding: the primary channel through which the World Cup lifted hotel performance in these eleven markets were through price increases rather than occupancy. ADR lift came at a cost. In most host cities, dynamic pricing during match weeks priced out price-sensitive transient demand and displaced group and meeting business to other periods or other markets, leaving occupancy below the counterfactual baseline.

RevPAR Impact in Percentage Terms

While the RevPAR impact figures discussed above indicate which markets captured the largest absolute revenue gain during World Cup match weeks, they do not by themselves indicate which markets were most effective at optimizing pricing relative to their normal rate environment. A market with a naturally high baseline RevPAR can post a large dollar gain while achieving only a modest relative lift, while a market with a lower baseline RevPAR can post a much smaller dollar gain that nonetheless represents a substantially larger proportional increase. Measuring the impact as a percentage change from the counterfactual baseline corrects for this difference in scale and offers a clearer read on which markets' hotels were most successful at optimizing revenue during the tournament.

Percent Change in RevPAR during Match Weeks
Sources: CoStar data and HVS Analysis

Viewed from this perspective, the ranking of markets shifts considerably. Kansas City, which ranked third in dollar RevPAR gain, recorded the largest percentage increase of any market by a wide margin, at 43.1%. Dallas followed at 30.1%, moving up from fifth in dollar terms to second on a percentage basis. New York remained near the top of the ranking at 23.5%, confirming that its performance was exceptional in both absolute and relative terms.

Houston and Boston posted nearly identical percentage gains, at 22.2% and 22.0% respectively, even though Boston's dollar RevPAR gain ($32.80) was more than four times the size of Houston's ($7.85). Houston's comparatively low baseline RevPAR meant that its smaller dollar gains still represented a relative pricing lift on par with Boston's much larger dollar gain. Miami rounded out the upper half of the ranking at 18.9%.

The lower half of the percentage ranking includes several markets that ranked considerably higher on a dollar basis. Los Angeles, which posted the fourth-largest dollar RevPAR gain, fell to eighth in percentage terms at 15.5%, and San Francisco fell from sixth in dollar terms to tenth on a percentage basis at 13.4%. In both cases, a relatively high baseline RevPAR meant that a meaningful dollar gain translated into a comparatively modest relative increase. Seattle shows the opposite pattern: despite posting the second smallest dollar RevPAR gain in the study, its low baseline RevPAR meant that gain translated into a 15.7% increase, moving it up from tenth to seventh in the percentage ranking. Philadelphia held roughly steady across both measures, at 14.8%. Atlanta again ranked last, at 9.4%, though even this smallest percentage increase represents a meaningful relative gain and confirms that every one of the eleven host markets experienced a positive pricing effect from the World Cup.

The percentage-change view indicates that the markets most successful at optimizing pricing during World Cup match weeks were not necessarily the largest gateway markets or those with the highest baseline rates. Kansas City and Dallas, both comparatively lower-rate markets, achieved the greatest relative pricing lift of the eleven cities studied, while some higher-rate markets, such as Los Angeles and San Francisco, generated large dollar gains but comparatively modest relative price increases. We discuss the market-specific factors likely to drive these differences later in this report.

Rooms Revenue Impact by Market

Across the eleven host cities, the World Cup generated an estimated $680 million in incremental rooms revenue during match weeks. New York alone accounted for roughly half of the total, at $339.2 million, reflecting both its status as by far the largest hotel market of the eleven and the fact that it hosted eight matches. Los Angeles ($77.2 million) and Boston ($69.3 million) formed a clear second tier, followed by Dallas ($60.8 million) and Miami ($34.2 million). The remaining six markets — Kansas City, Houston, San Francisco, Philadelphia, Atlanta, and Seattle — each generated less than $25 million, ranging from $23.7 million down to $8.2 million.

Room Revenue Changes during Match Weeks
Sources: CoStar data and HVS Analysis

The number of matches a city hosted was one of the drivers of total revenue impact. Each match created a discrete window of compressed demand and elevated rates, so markets hosting more matches generally had more opportunities to accumulate incremental revenue. Dallas, which hosted nine matches, the most of any market, and Boston, Miami, and Houston, each with seven, all rank among the stronger revenue producers, consistent with match count contributing meaningfully to total impact.

At the same time, match count alone does not fully explain the revenue outcome, and the rooms-revenue-per-match figures make this clear. New York and Atlanta each hosted eight matches, yet New York's per-match revenue impact ($42.4 million) was more than 30 times Atlanta's ($1.2 million), and its total impact was more than 35 times larger. As a gateway city for European travelers, New York may have benefited from increased international visitation from travelers extending their trips to matches in other cities.

Baseline Occupancy as a Predictor of ADR Gains

Among the variables examined in this analysis, the occupancy rates that each market would have achieved absent the World Cup (the counterfactual occupancy rate) show the strongest relationship to the size of the ADR gain a market ultimately captured. Across the eleven host cities, markets that would ordinarily have run at high occupancy captured the largest ADR gains, while markets with more spare capacity in a typical year captured comparatively smaller gains, as illustrated in the figure below.

ADR Gains Versus Occupancy Rate
Sources: CoStar data and HVS Analysis

New York illustrates this relationship most clearly. Its counterfactual occupancy of 89.4%, by a wide margin the highest of the eleven markets, was paired with the largest ADR gain in the study, at $62.3. Boston, with the second-highest counterfactual occupancy at 78.2%, produced the second-largest RevPAR gain, at $43.8. At the other end of the range, Houston's counterfactual occupancy of 61.2%, the lowest of the eleven markets, corresponded with one of the smaller ADR gains, at $17.1.

The relationship holds broadly across the middle of the distribution as well: Los Angeles, Miami, and San Francisco all cluster in the low-to-mid 70% range for counterfactual occupancy, and most produced ADR gains in a comparatively narrow band. This pattern is consistent with how compression works in a hotel market. A market that already operates near capacity in a normal year has little spare inventory to absorb incremental event-driven demand, so that demand is forced almost entirely into rate, producing a large ADR gain. A market with more room to spare can absorb a portion of that demand within its existing capacity and has less leverage to increase room rates. As shown in prior research[2], the relationship between ADR and occupancy is non-linear as the ability to increase rate grows more rapidly as occupancy increases.

Baseline occupancy alone, however, does not fully explain the results, and the markets that deviate most from what their occupancy rate would predict share a common geographic characteristic: the physical relationship between the match venue and the city's core cluster of large hotels and convention center. In Seattle, Philadelphia, and Atlanta, the stadium hosting World Cup matches sits close to, or within the same district, as the primary convention hotel cluster. In these markets, World Cup demand displaced hotel groups and convention events that would have used the pool of large hotels. Event planners either postponed or relocated their events to other markets. This offset a meaningful share of the rate gains generated by World Cup visitation. As a result, all three markets underperformed relative to what their counterfactual occupancy rate alone would predict: Seattle's high baseline occupancy (79.7%, second-highest of the eleven markets) would suggest a RevPAR gain closer to Boston's, yet it produced only $26.6; Philadelphia's baseline occupancy of 73.9% placed it in the upper half of the study, yet its $19.0 gain ranked near the bottom; and Atlanta, with Mercedes-Benz Stadium adjacent to the Georgia World Congress Center, produced the smallest ADR gain of any market, $8.3, despite a mid-range baseline occupancy of 67.6%.

New York, Boston, and Kansas City show the opposite pattern. In each of these markets, the match venue is located at some distance from the primary concentration of large hotels and convention center, which allowed World Cup-related transient demand to be absorbed largely independently of the market's existing group and convention business, without displacing it to the same degree. Because that group and convention base remained largely intact even as World Cup demand pushed rates upward, these markets captured a fuller share of the potential rate gain. This effect is most visible in Kansas City, which produced the third-largest RevPAR gain in the study, $41.1, despite ranking eighth of eleven markets in baseline occupancy, a baseline occupancy alone would not predict, but which is consistent with the venue's distance from the market's core hotel and convention cluster.

Influence of Team Composition

The size of each participating country's fan base, and that fan base's disposable income and ability to travel internationally, likely contributed to differences in room night demand across the eleven markets. Countries with smaller populations and more limited disposable income and travel capacity, including Haiti, Iran, Jordan, Cabo Verde, Senegal, Côte d'Ivoire, and Curaçao, generated comparatively fewer room nights from traveling fans. By contrast, teams from larger, wealthier countries with strong travel propensity, such as France, England, and Spain, drew significantly more visiting fans, as did Latin American teams with especially large and devoted fan followings, such as Brazil and Argentina.

Conclusion

This analysis demonstrates that the 2026 FIFA World Cup generated a substantial but highly uneven impact on hotel performance across its eleven U.S. host markets, producing an estimated $680 million in incremental rooms revenue overall. Rather than translating primarily into higher occupancy, the tournament's effect was felt mainly through rate. Dynamic pricing during match weeks pushed ADR higher in every market, even as occupancy declined in most of them as price-sensitive individual travelers were priced out and group and convention business was postponed or displaced to other markets. The magnitude of each market's RevPAR gain was shaped by several interacting factors: a market's baseline occupancy level heading into the tournament, the number of matches it hosted, the proximity of the match venue to its core cluster of convention hotels, and the size and travel propensity of the fan bases of the specific national teams playing there. New York, Boston, and Kansas City stand out as the markets that captured the fullest benefit of the tournament, while Atlanta, Seattle, and Philadelphia illustrate how proximity between the event venue and a market’s convention hotel base can constrain the net gain by displacing existing group demand. These findings suggest that a market's ability to capture value from a major international sporting event depends less on simply hosting matches than on the underlying structure of its hotel supply, its existing occupancy levels, and the degree to which event-driven demand competes with, rather than complements, the market's existing business base.

[1] HVS, ""How Convention Centers Change Hotel Markets." Retrieved June 1, 2026,

[2] IBID