Lodging Industry Overview
Source: STR Global
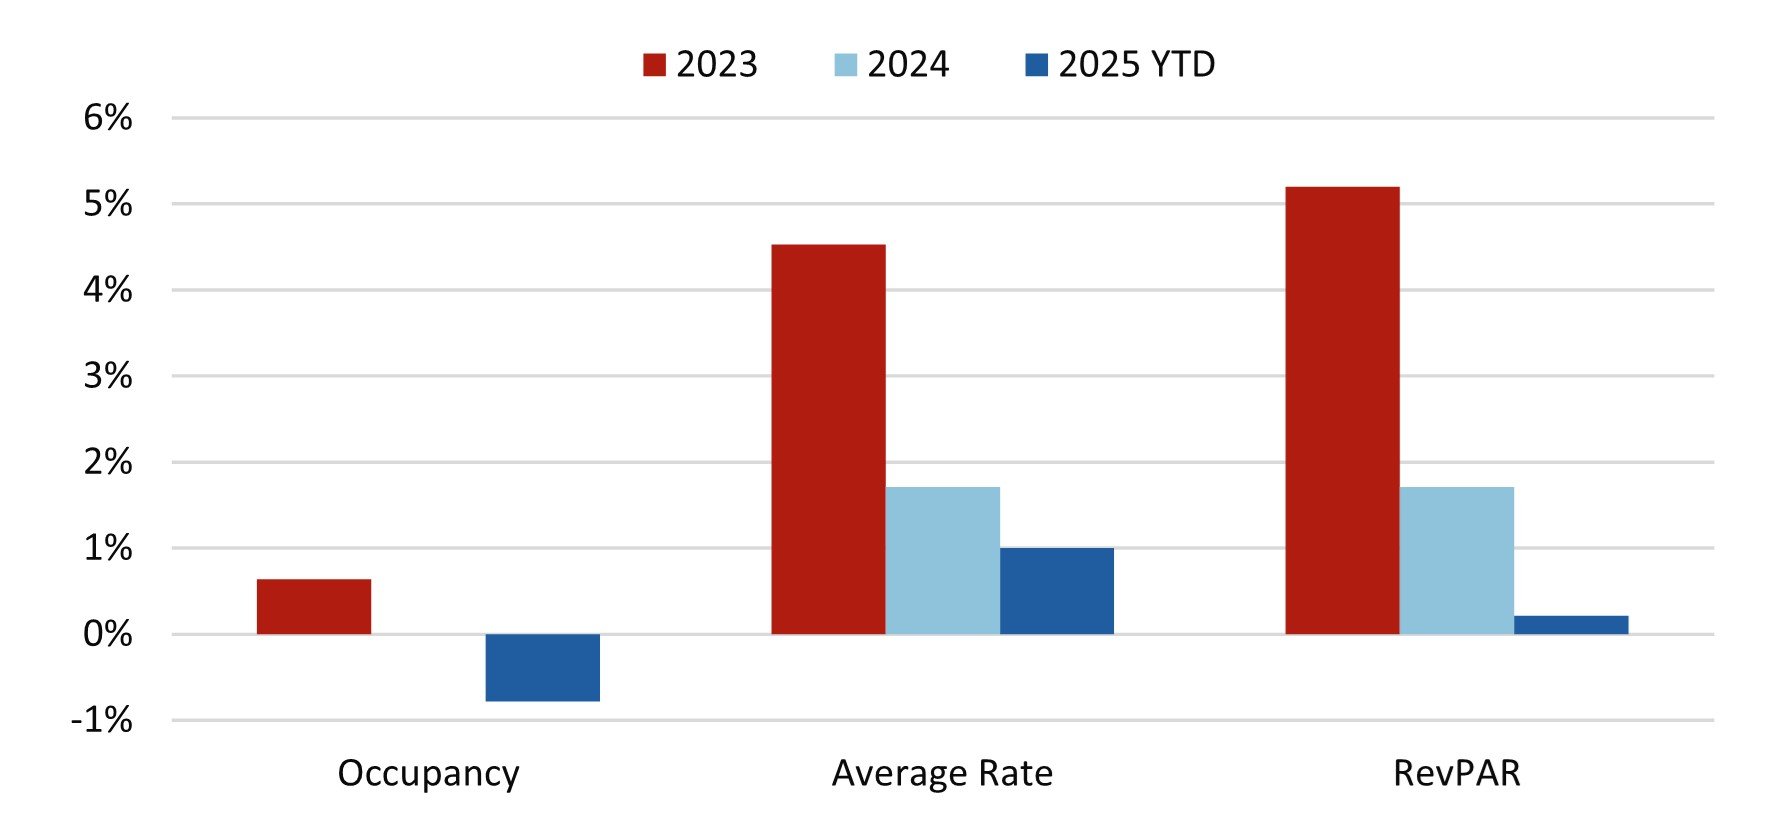
Occupancy levels have declined in early 2025 compared to the same period in 2024, with ADR growth also slowing due to reduced leisure travel and greater consumer price sensitivity. Preliminary 2025 data through August suggests minimal RevPAR growth, reflecting weaker travel sentiment across many markets, particularly among international travelers, despite modest gains in ADR. The figure below illustrates year-over-year RevPAR trends for the top 25 major U.S. markets.
Top 25 US Lodging Markets Year-Over-Year Growth of RevPAR
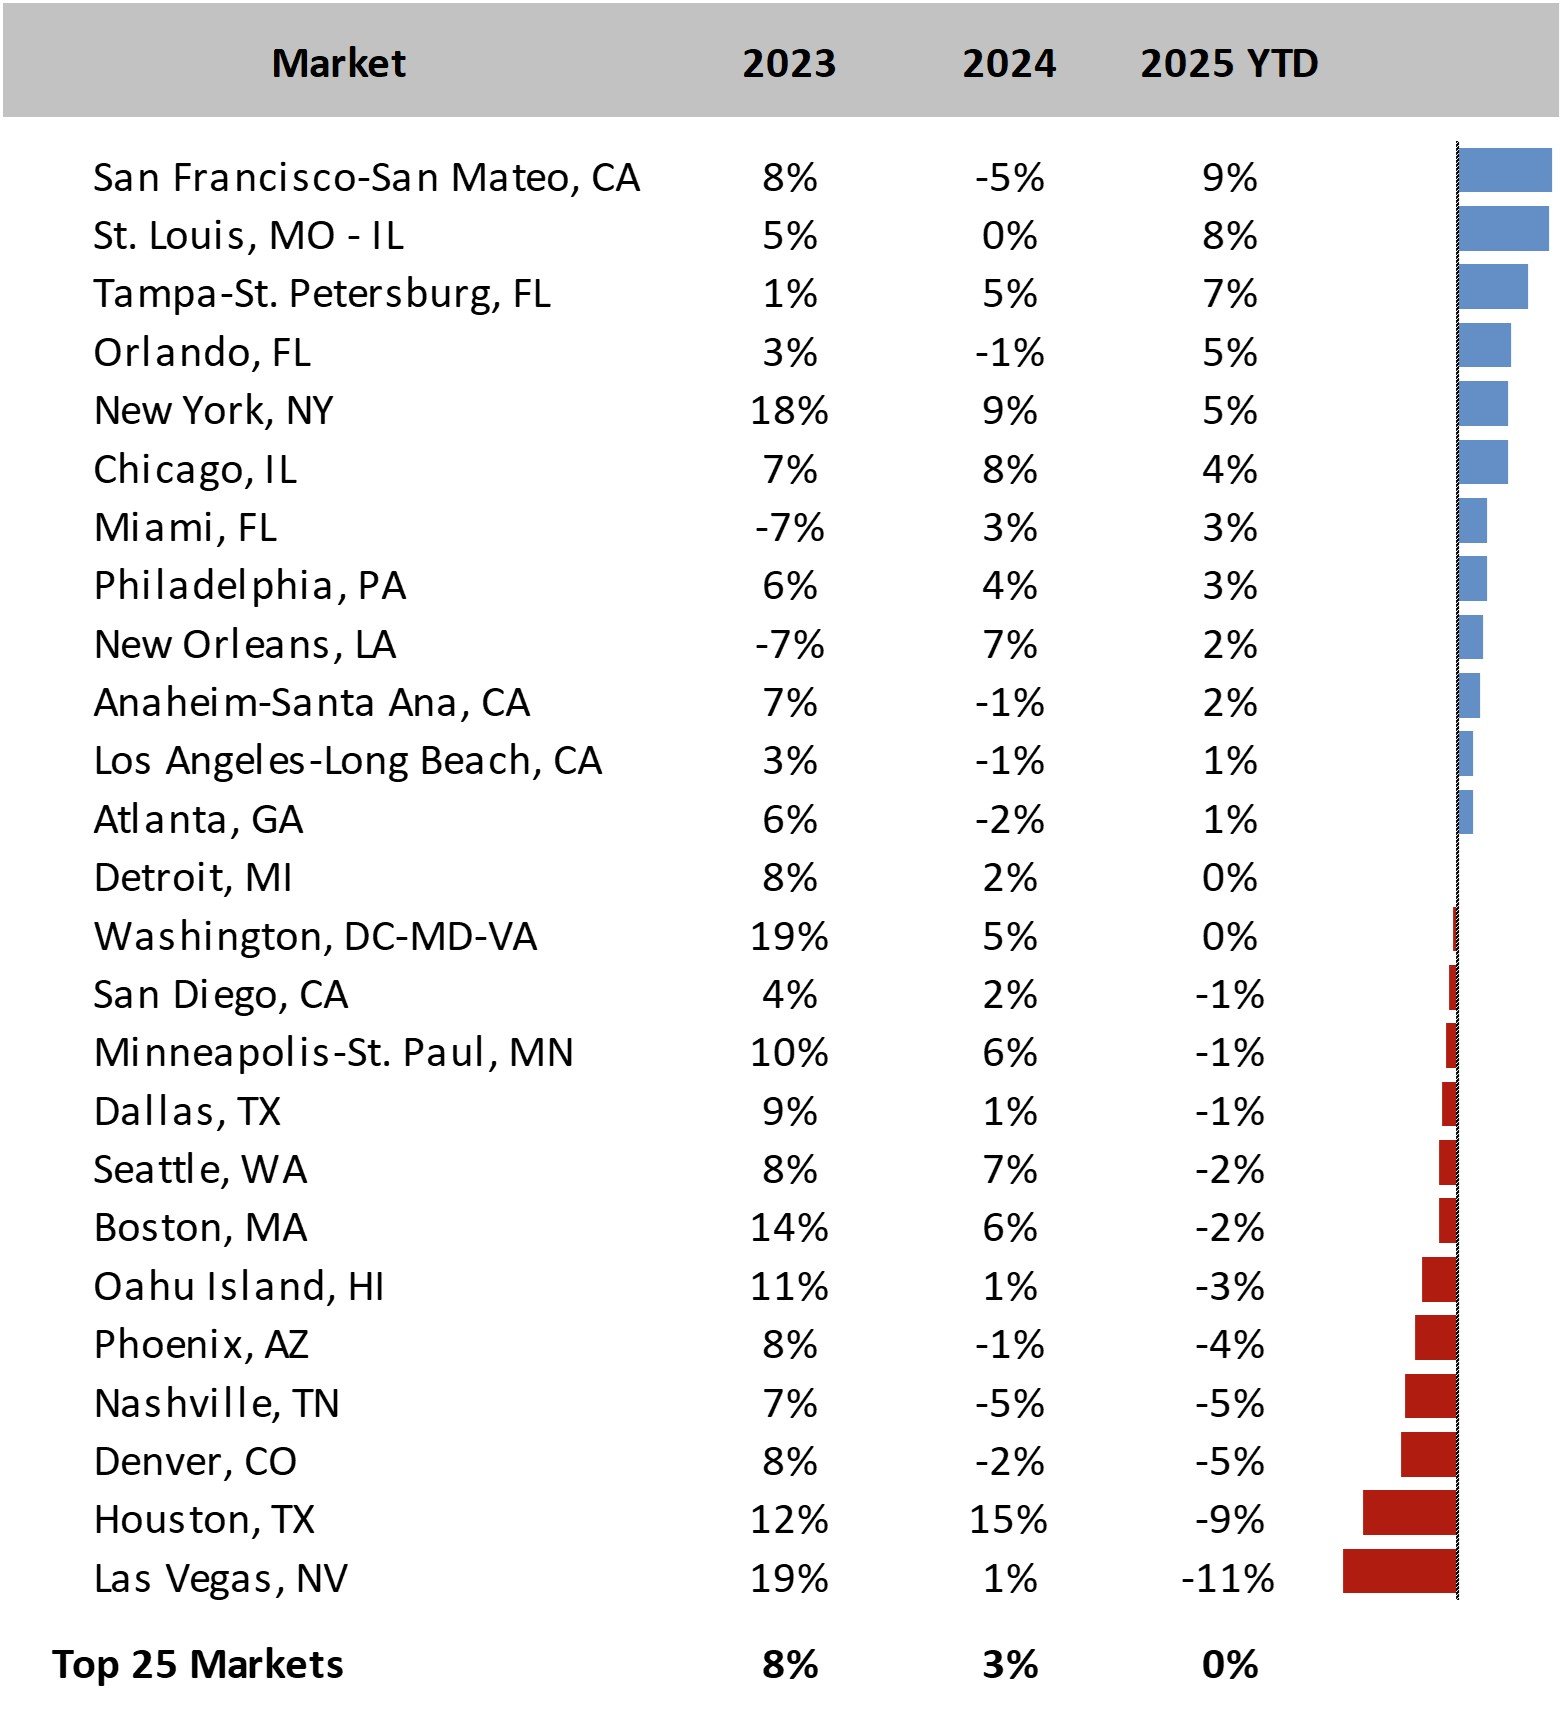
Source: STR Global
Higher operating costs and unfavorable credit market conditions continue to slow the development of new lodging supply. With lower RevPAR growth and limited new supply, lodging tax revenue growth is likely to slow in most lodging markets in 2025 and 2026.
Economic Uncertainty
Until more clarity emerges, the near-term outlook remains uncertain due to the factors mentioned above. The possibility of increased inflation, rising unemployment, and a recession remains a topic of concern. Slower growth and lower levels of new job creation are considered the most likely outcomes. Over the long term, the hospitality industry has proven to be extraordinarily resilient following past “shock” events and downturns such as 9/11, the Great Recession, and the COVID-19 pandemic. Despite temporary declines, the industry’s performance has consistently recovered and continued to grow. Thus, we are confident the industry will prove to be similarly resilient following the current period of uncertainty.
Labor Force
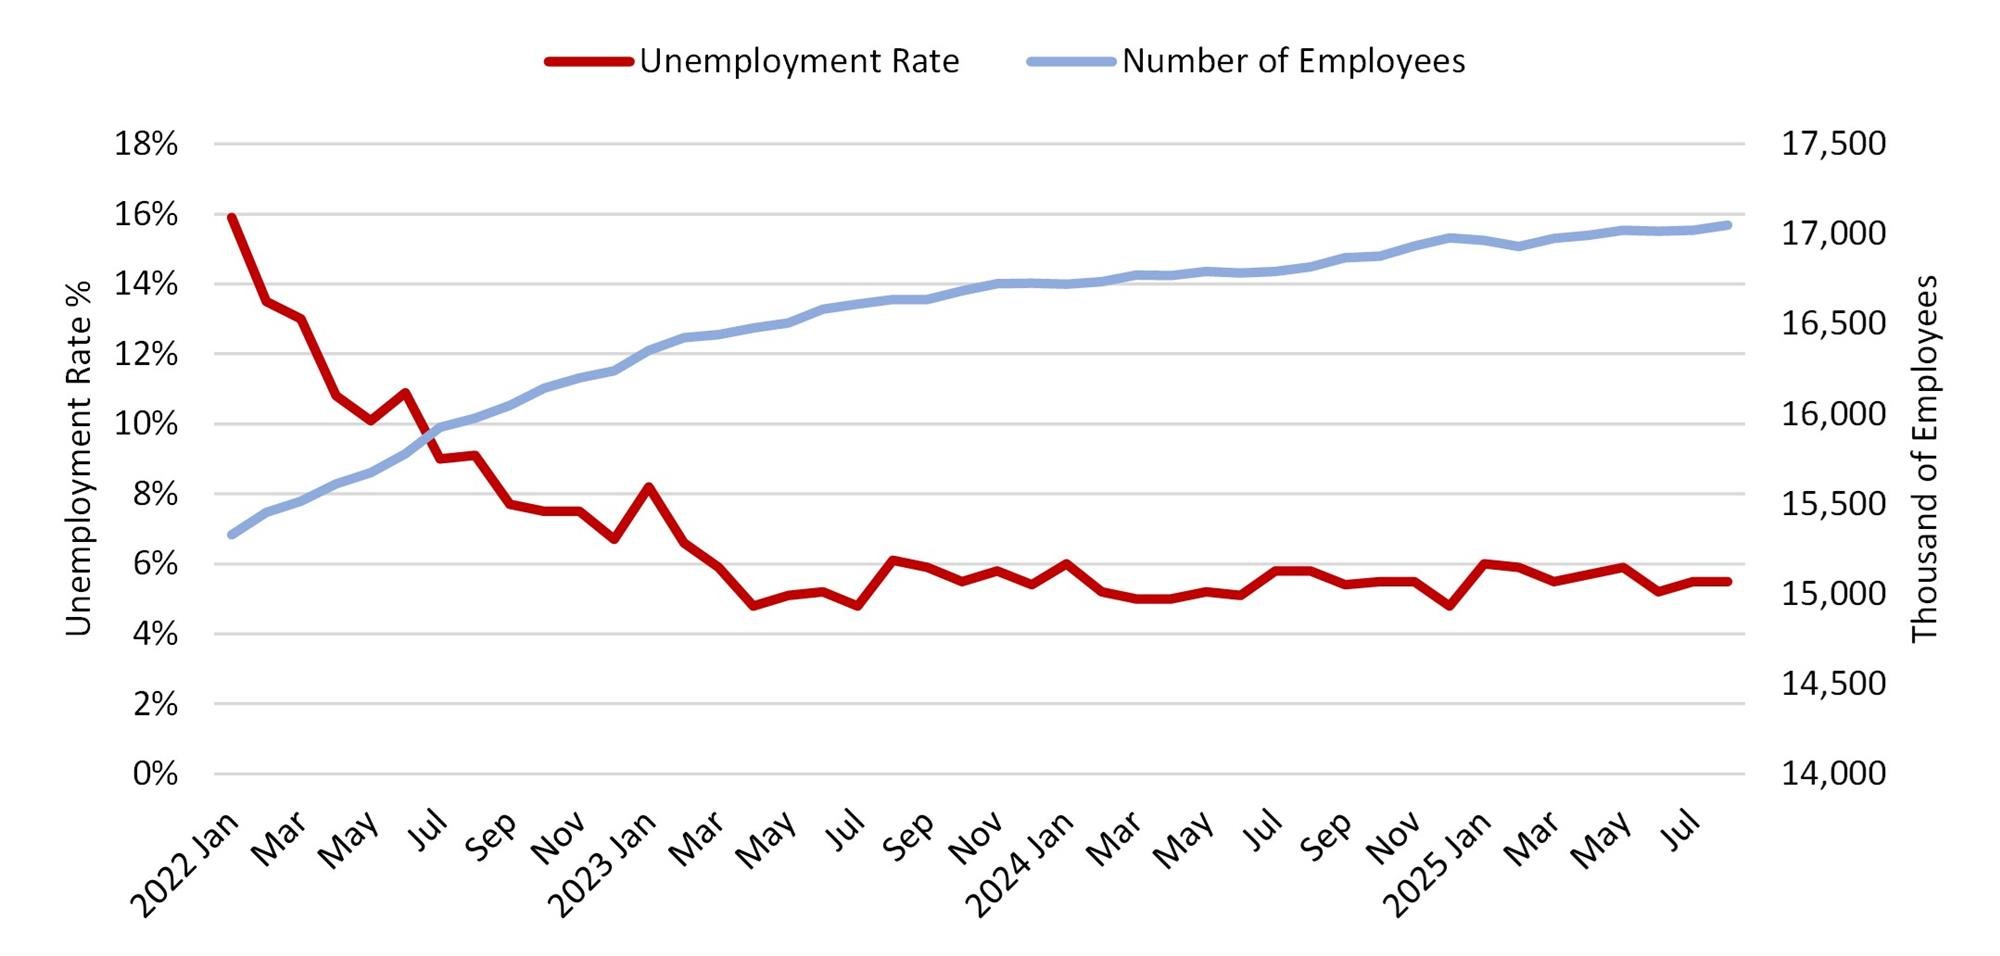
Source: Bureau of Labor Statistics
Imposition of Lodging Taxes
From a political perspective, lodging taxes may be easier to impose than other taxes because visitors who use lodging accommodations are not constituents of the local municipalities. Typically, hotel operators collect the tax from guests and receive a small administrative fee of one or two percent of collections.
While the tax's legal incidence may fall on the consumer, the economic burden of the lodging tax is shared by both lodging providers and their guests. A lodging tax raises the price of lodging accommodations. Depending on the elasticity of the supply and demand for lodging, the hotel manager may be unable to increase its room rates enough to compensate for paying the full amount of the tax. Since the elasticity of supply and demand changes depending on market conditions, the true incidence of a lodging tax varies as market conditions change. This study does not attempt to estimate the economic incidence of lodging taxes.
Hotel owners are often willing to cooperate with local governments to impose lodging taxes dedicated to tourism promotion and the construction of convention centers. For hotel owners, tourist-oriented public facilities and advertising serve as drivers of room demand. All hotels in a given market can benefit from programs that bring tourists and convention attendees to a city. Sponsoring these types of programs would be prohibitively expensive for any individual hotel. In the case of convention centers funded by a lodging tax, the hotels and individuals who benefit from the center pay for its construction and maintenance. Municipalities seek to benefit from visitor spending and the associated tax revenue generated by convention centers. By imposing lodging taxes, those who benefit pay for advertising, marketing, and sales efforts funded by lodging tax revenue.
Some states, particularly those with large tourism industries, prevent municipalities from depositing hotel tax revenue into their general funds. For example, Florida allows only a series of special-purpose taxes for tourist development. Texas requires local transient occupancy taxes to fund convention center development or tourism promotion.
Since the 1970s, lodging taxes have become commonplace across the country. Of the 150 largest U.S. cities examined in this study, more than 120 impose a dedicated tax, and all collect some form of taxation on hotel room revenue. In small suburban cities and major tourist destinations, lodging taxes have become a significant source of funding for economic development initiatives. This study aims to survey hotel tax implementation nationwide, providing information for those seeking to compare the structure and revenue capacity of lodging taxes across diverse markets.
Revenues from Lodging Taxes
Before the onset of the crisis, during the fiscal year 2019, the 25 major US markets generated approximately $3.6 billion in lodging tax revenue, as shown in the figure below.
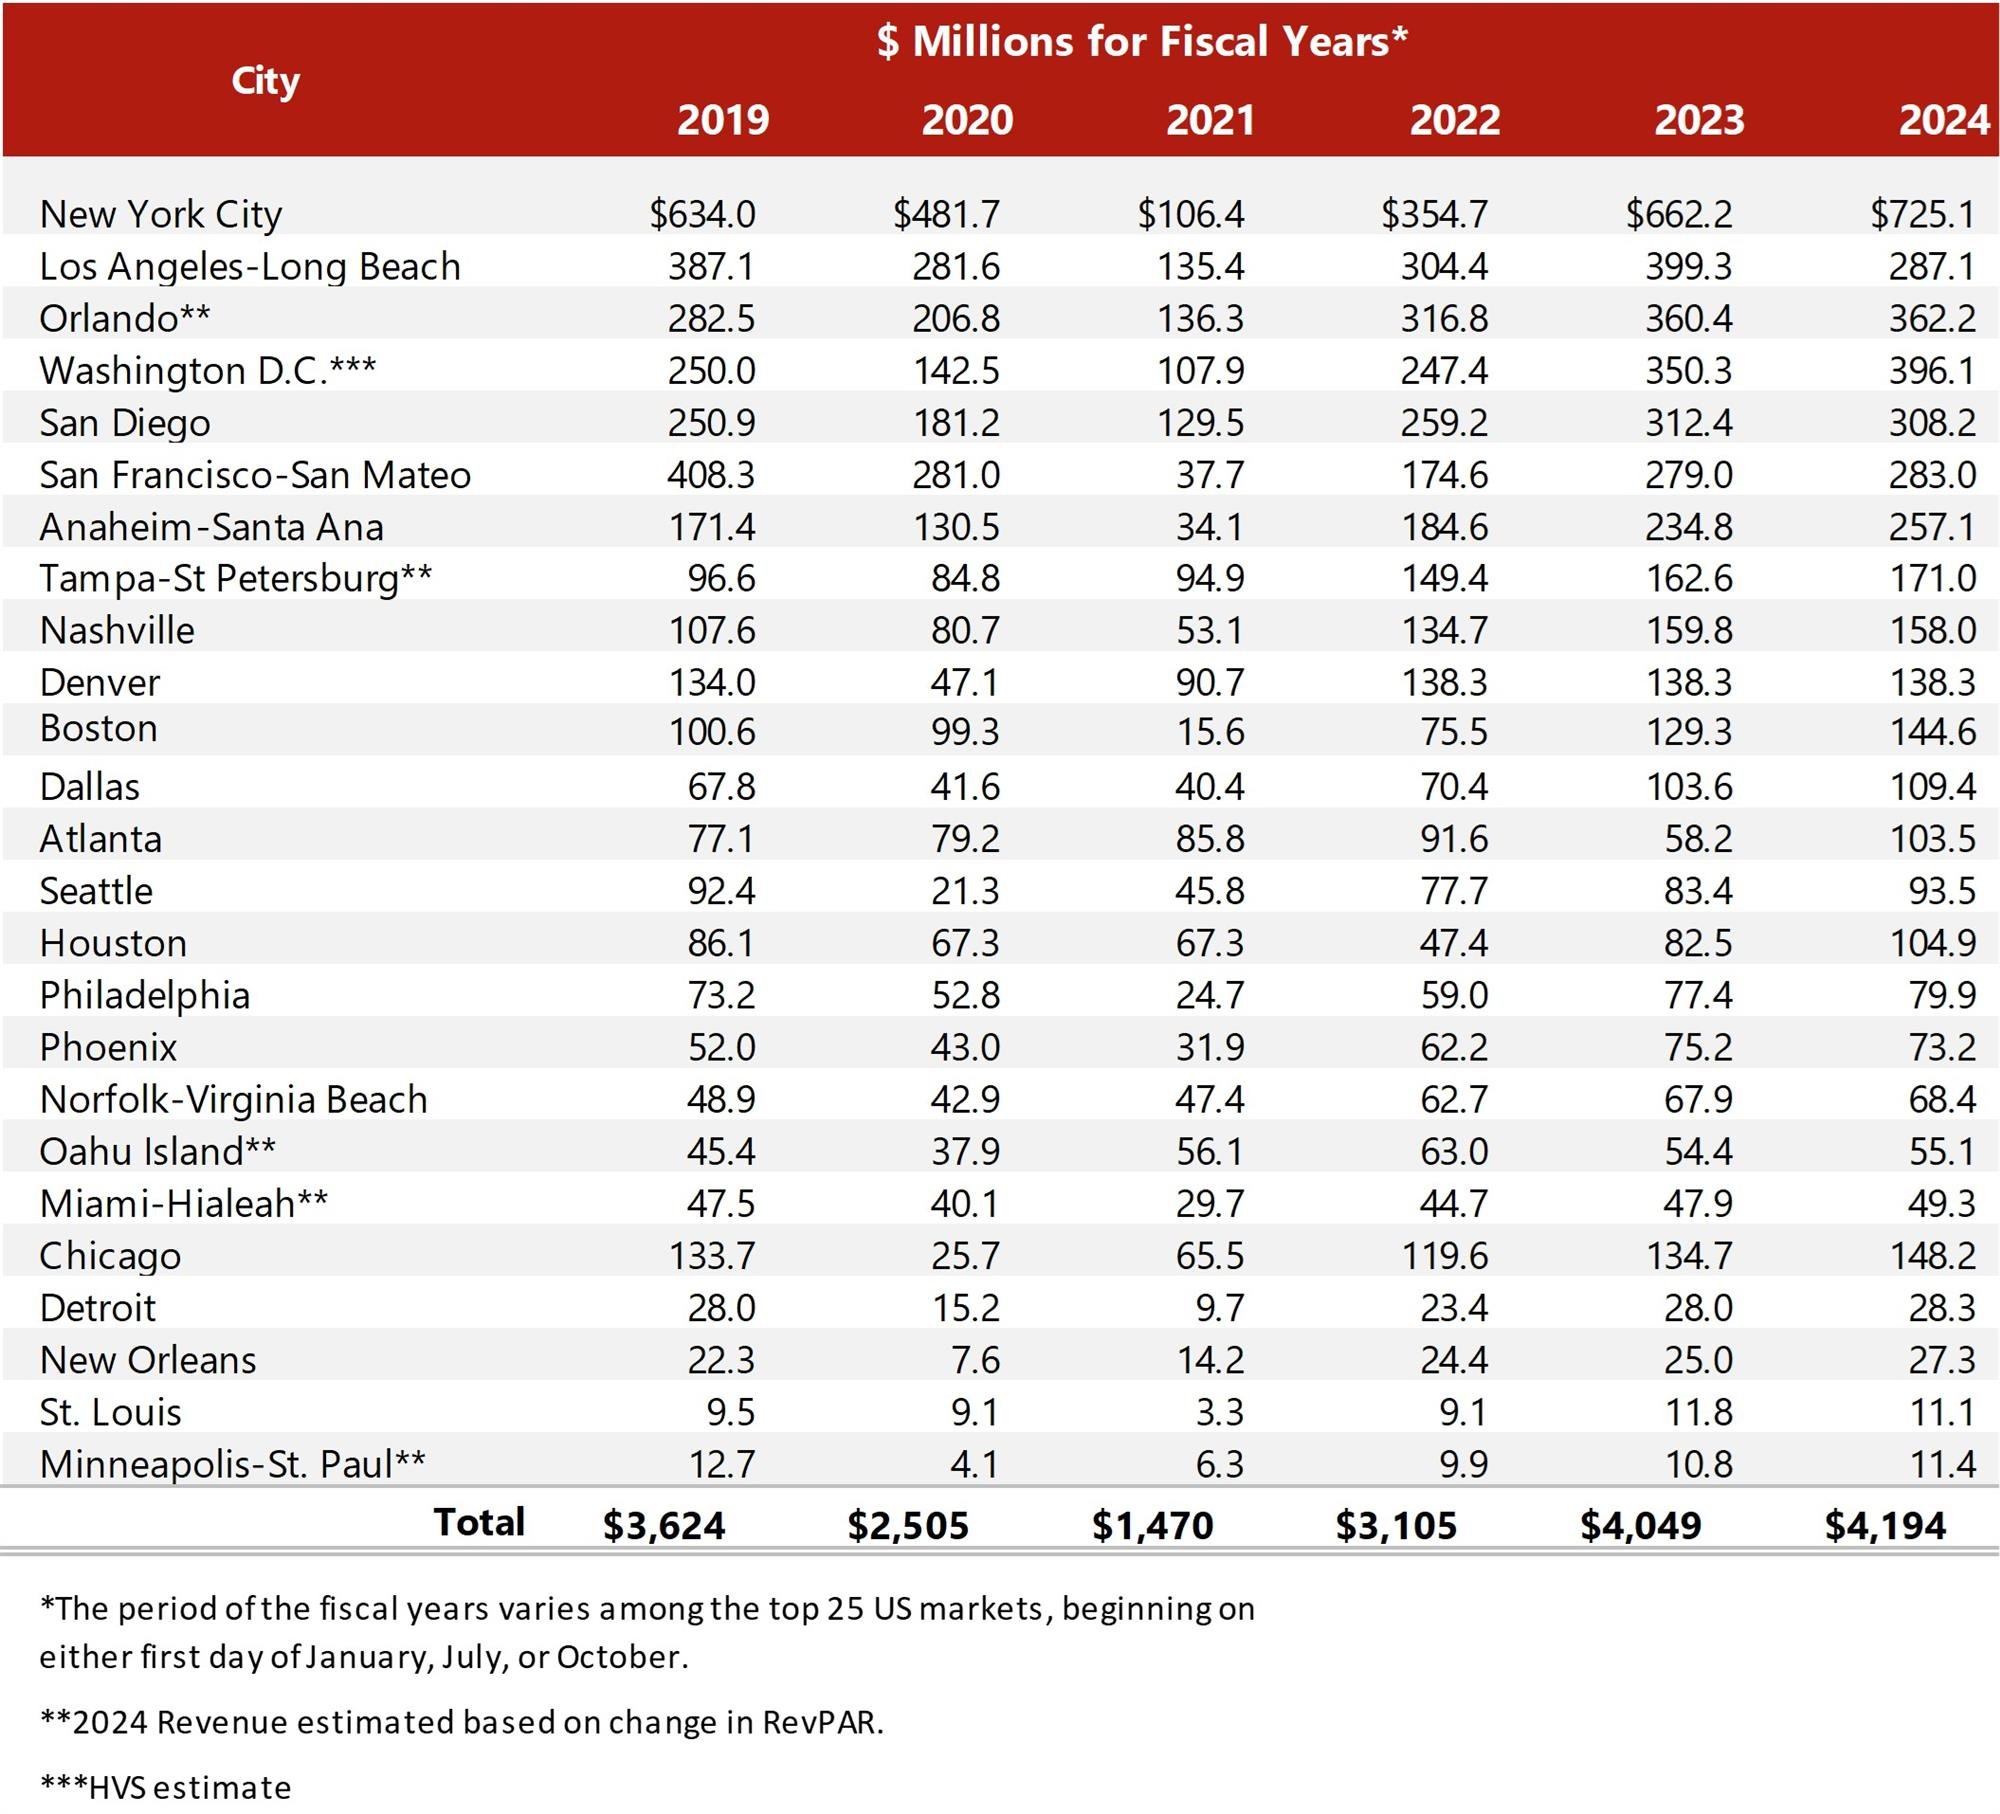
Source: Financial Statements of the Respective Governments
Changes in Lodging Tax Rates
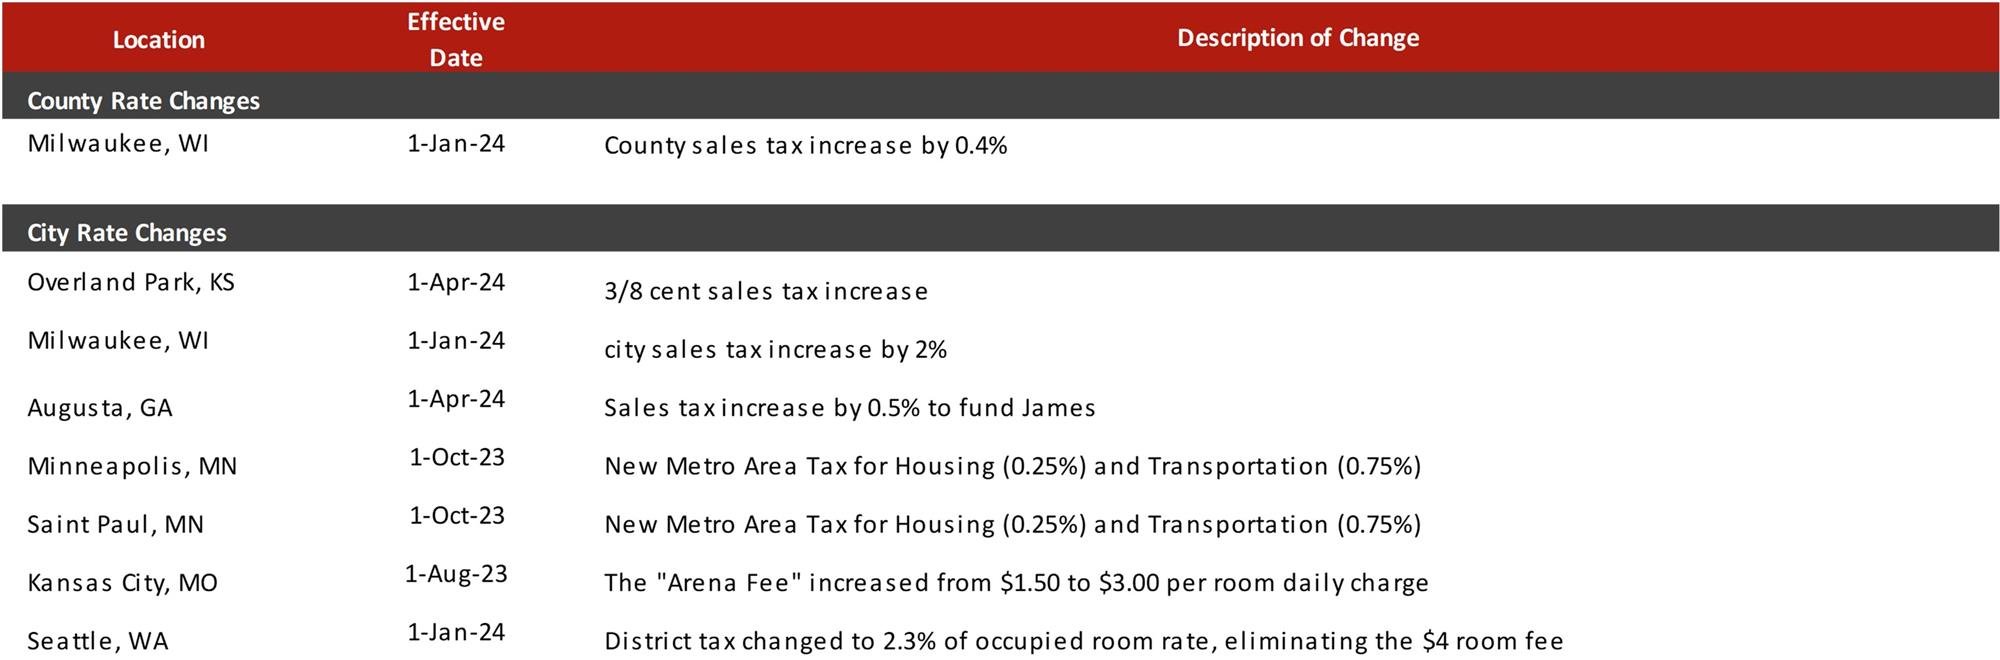
Source: Respective Jurisdictions
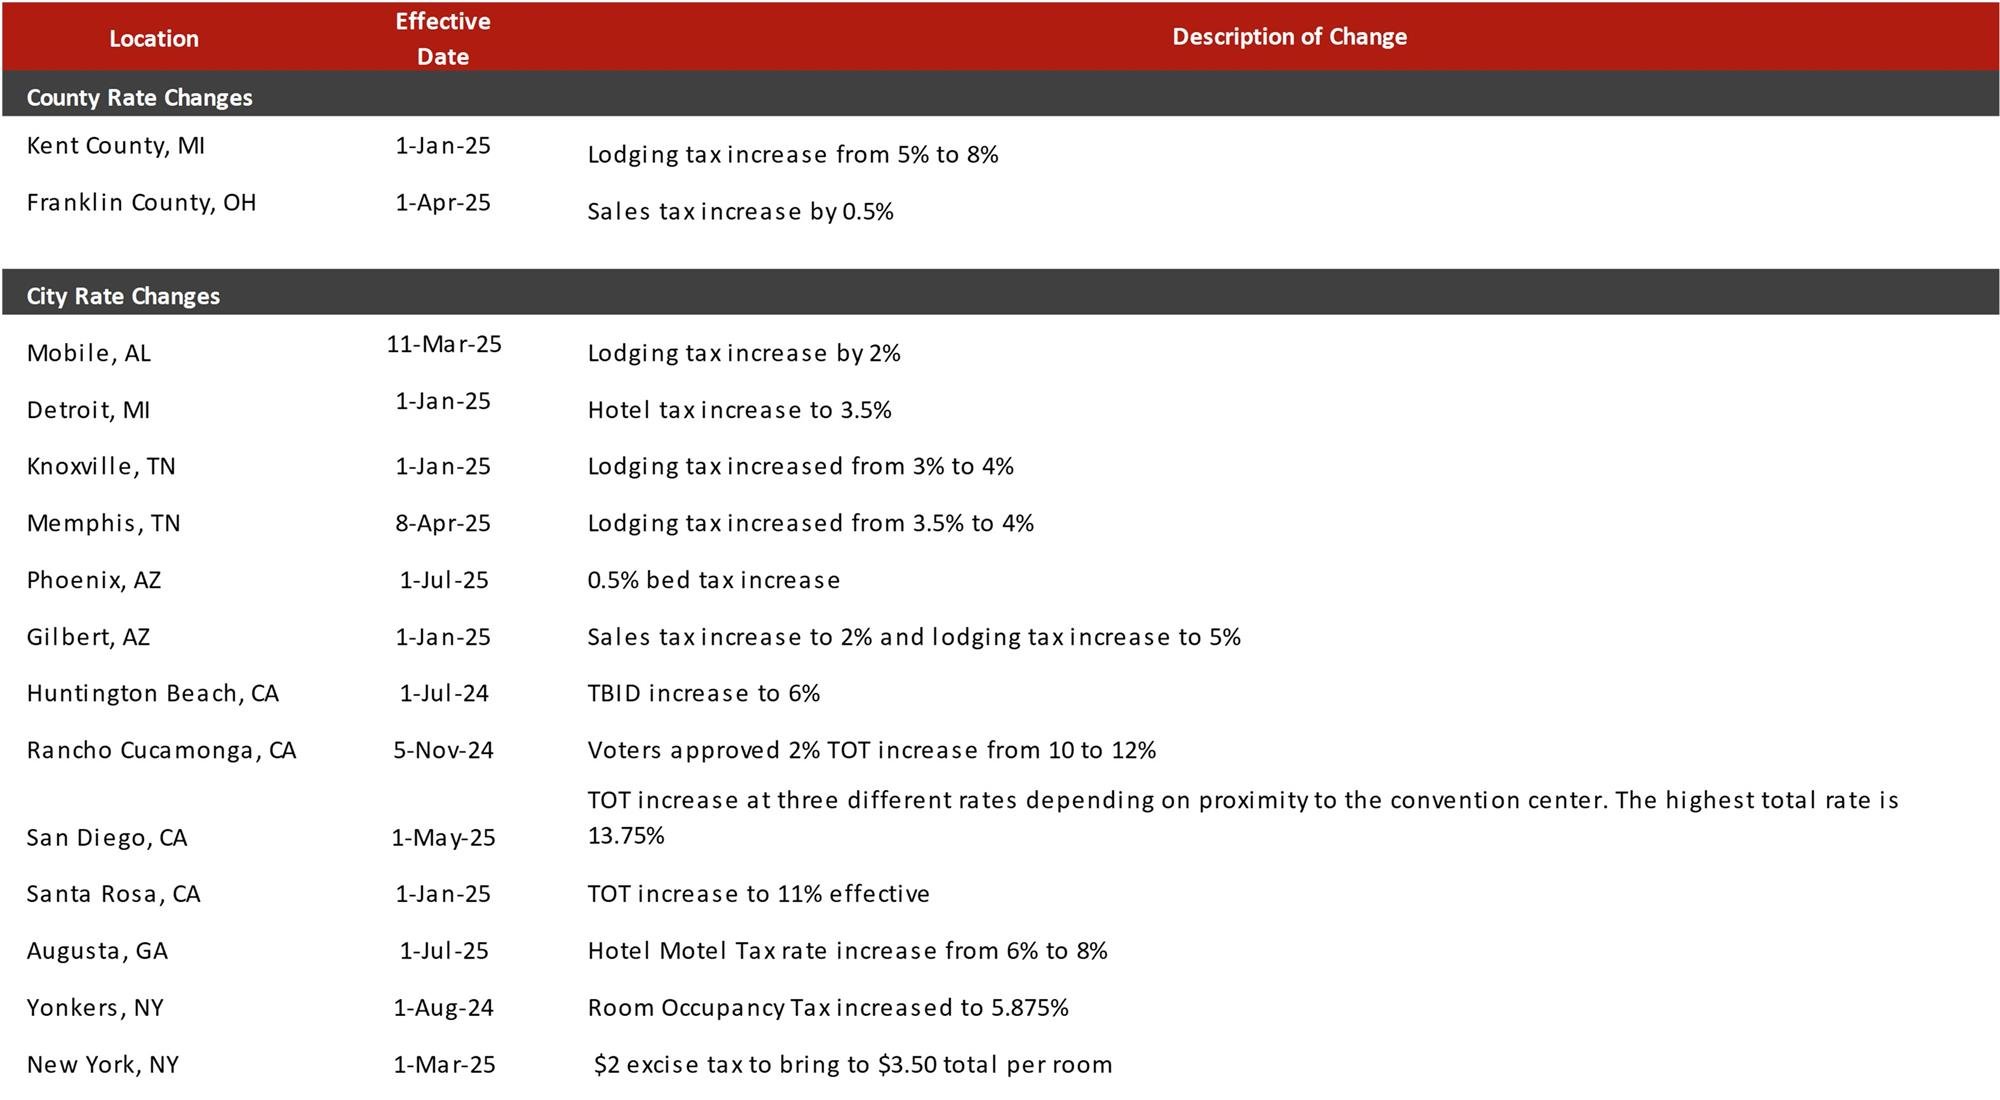
Source: Respective Jurisdictions
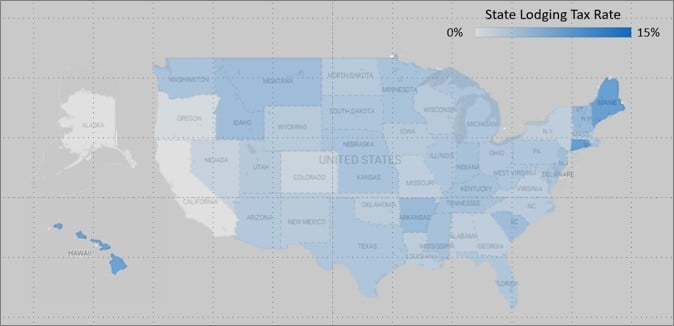
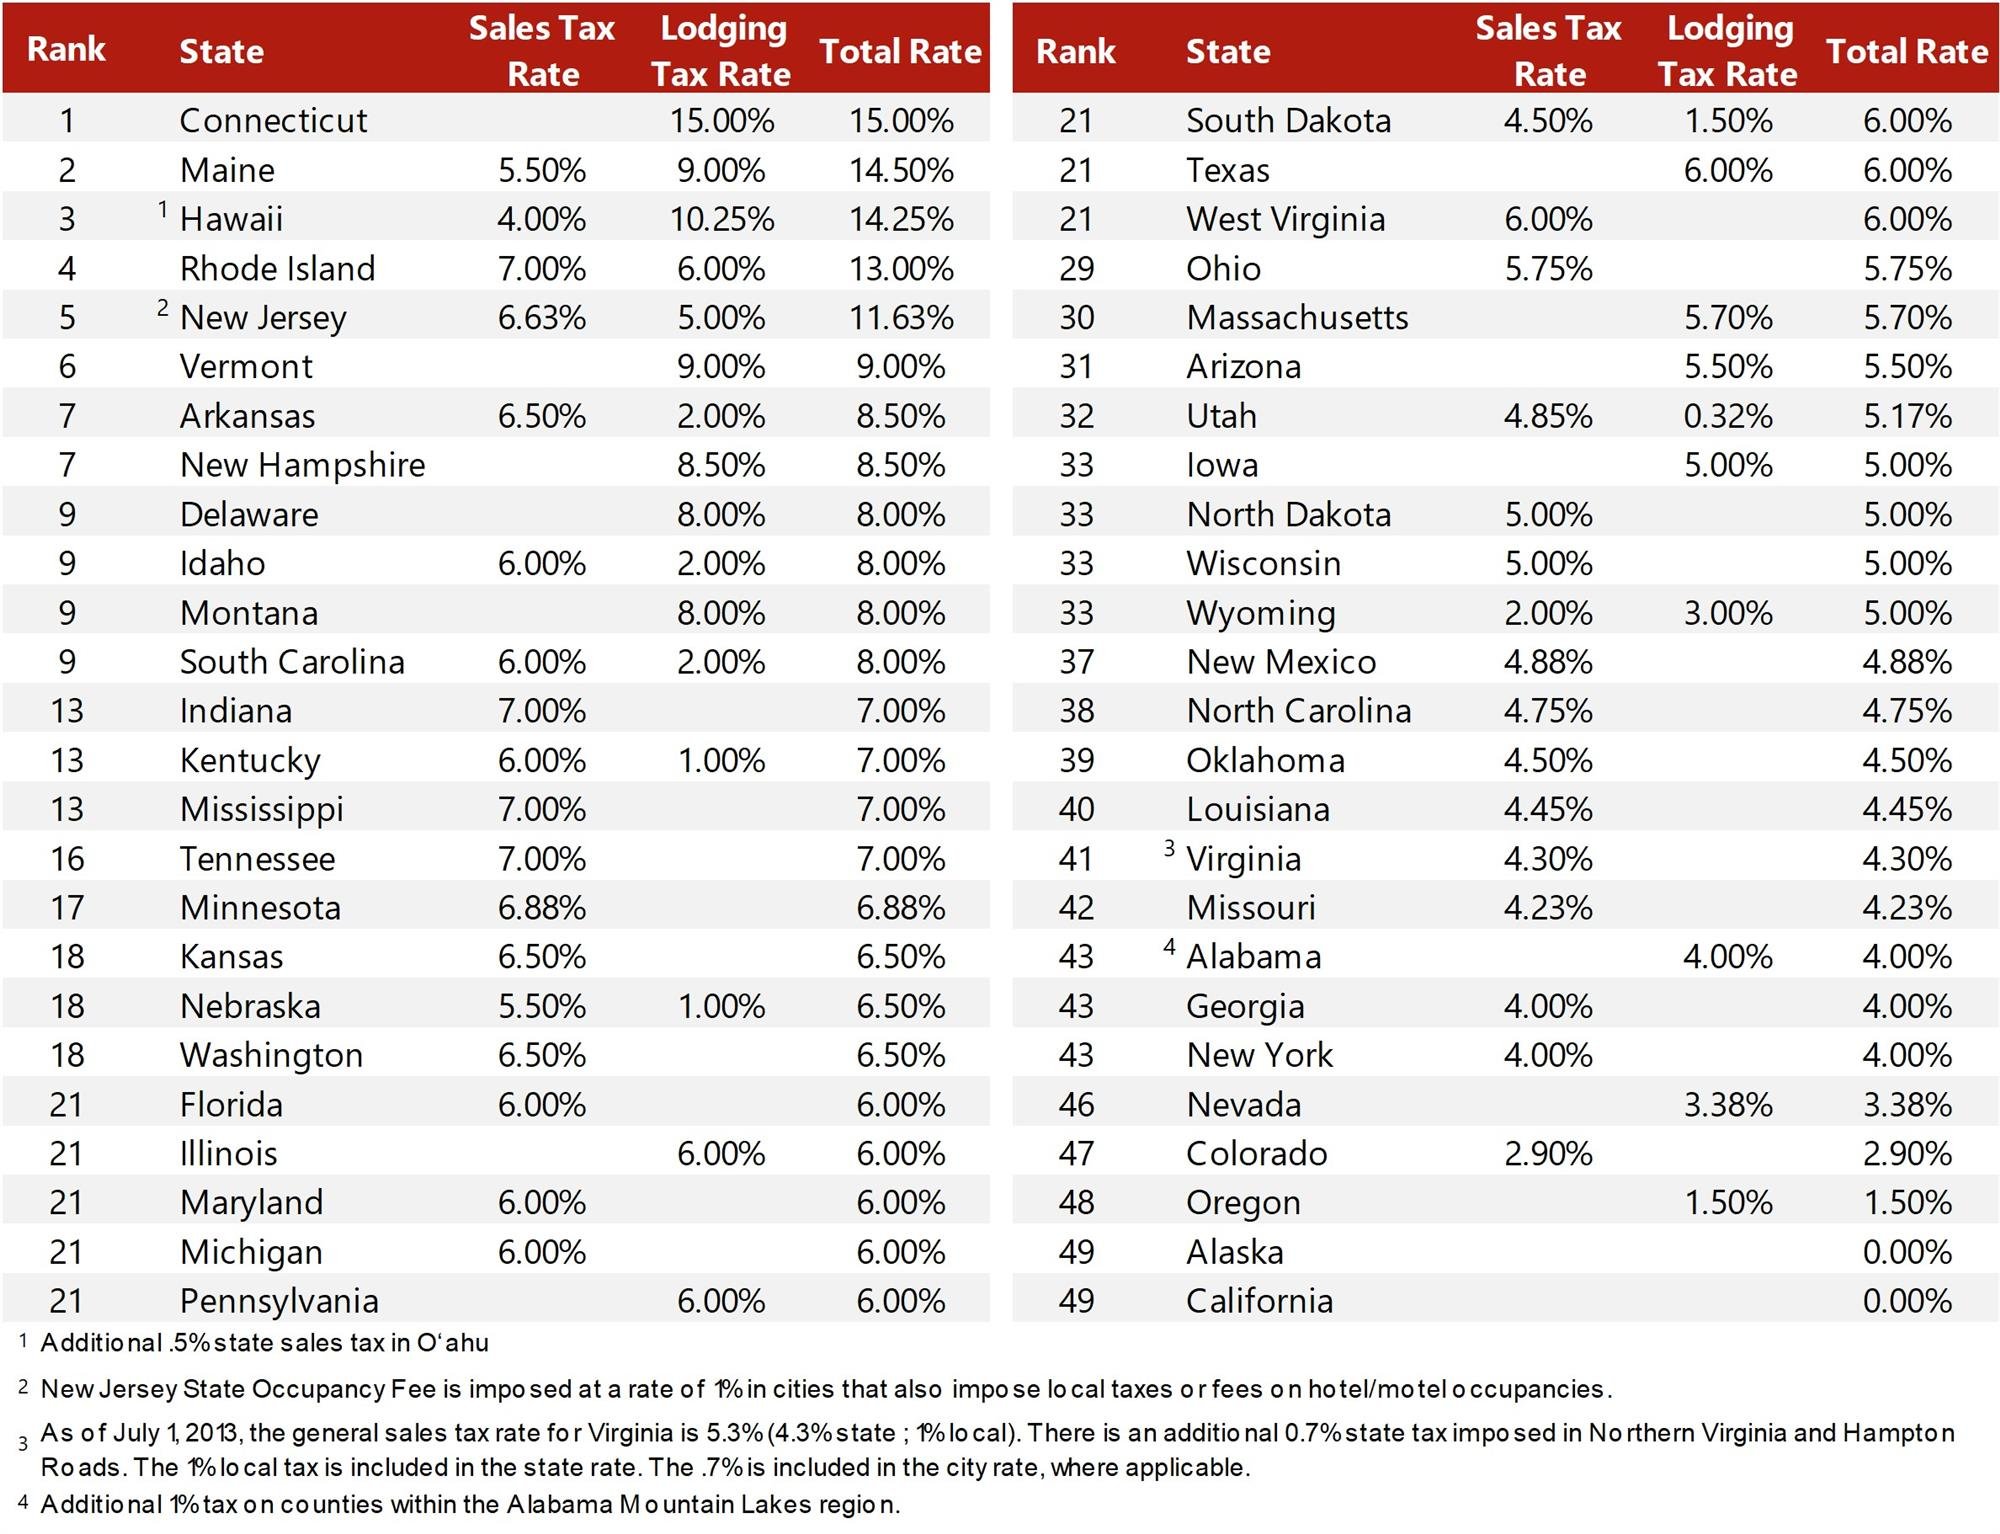
State Tax Rates
States with high lodging tax rates typically have more restrictions on imposing local lodging taxes. To illustrate, Connecticut has the highest statewide lodging tax rate at 15% but forbids all local authorities from imposing additional lodging taxes. On the other hand, Oregon imposes a low state lodging rate but does not restrict local taxes.
Source: HVS and Respective Jurisdictions
Source: Respective Jurisdictions
State Lodging Tax Revenue
Depending on the size of their tax liabilities, taxpayers may remit payments on a monthly, quarterly, or annual basis.
Administrative charges, payment of back taxes, and penalties may also affect the reported revenues, but the amounts are small. Only sales tax revenues in the accommodations sector were available in some states. Whereas lodging taxes are typically applied only to hotel room charges, sector-wide taxable sales might include other sources of taxable revenue, such as food and beverage revenue. We did not attempt to estimate the percentage of taxable sales due solely to overnight stays.
Among the states that collect lodging or sales tax on hotel rooms, total revenue increased by 4% in 2024 compared to 2023. This modest growth follows a 10.4% increase in 2023 and a large 89% surge in 2022, which was largely—if not entirely—attributable to the slowdown of travel during the COVID-19 pandemic. The smaller increase in 2024 suggests that revenue growth is beginning to stabilize. Notably, not all states that reported lodging tax revenues in 2024 saw year-over-year increases, indicating that the sharp recovery gains seen in the immediate aftermath of the pandemic have started to level off.
The following table page presents a six-year history of lodging tax revenue for each of the twenty-five states that have imposed a dedicated lodging tax. Revenue reported from past years has been adjusted for inflation. Data is presented in millions of dollars, and the states are ranked by 2024 revenues.
.jpg)
Source: Respective Jurisdictions
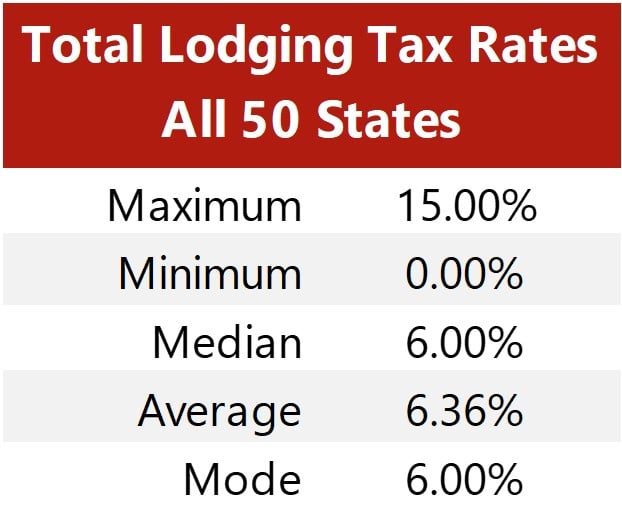
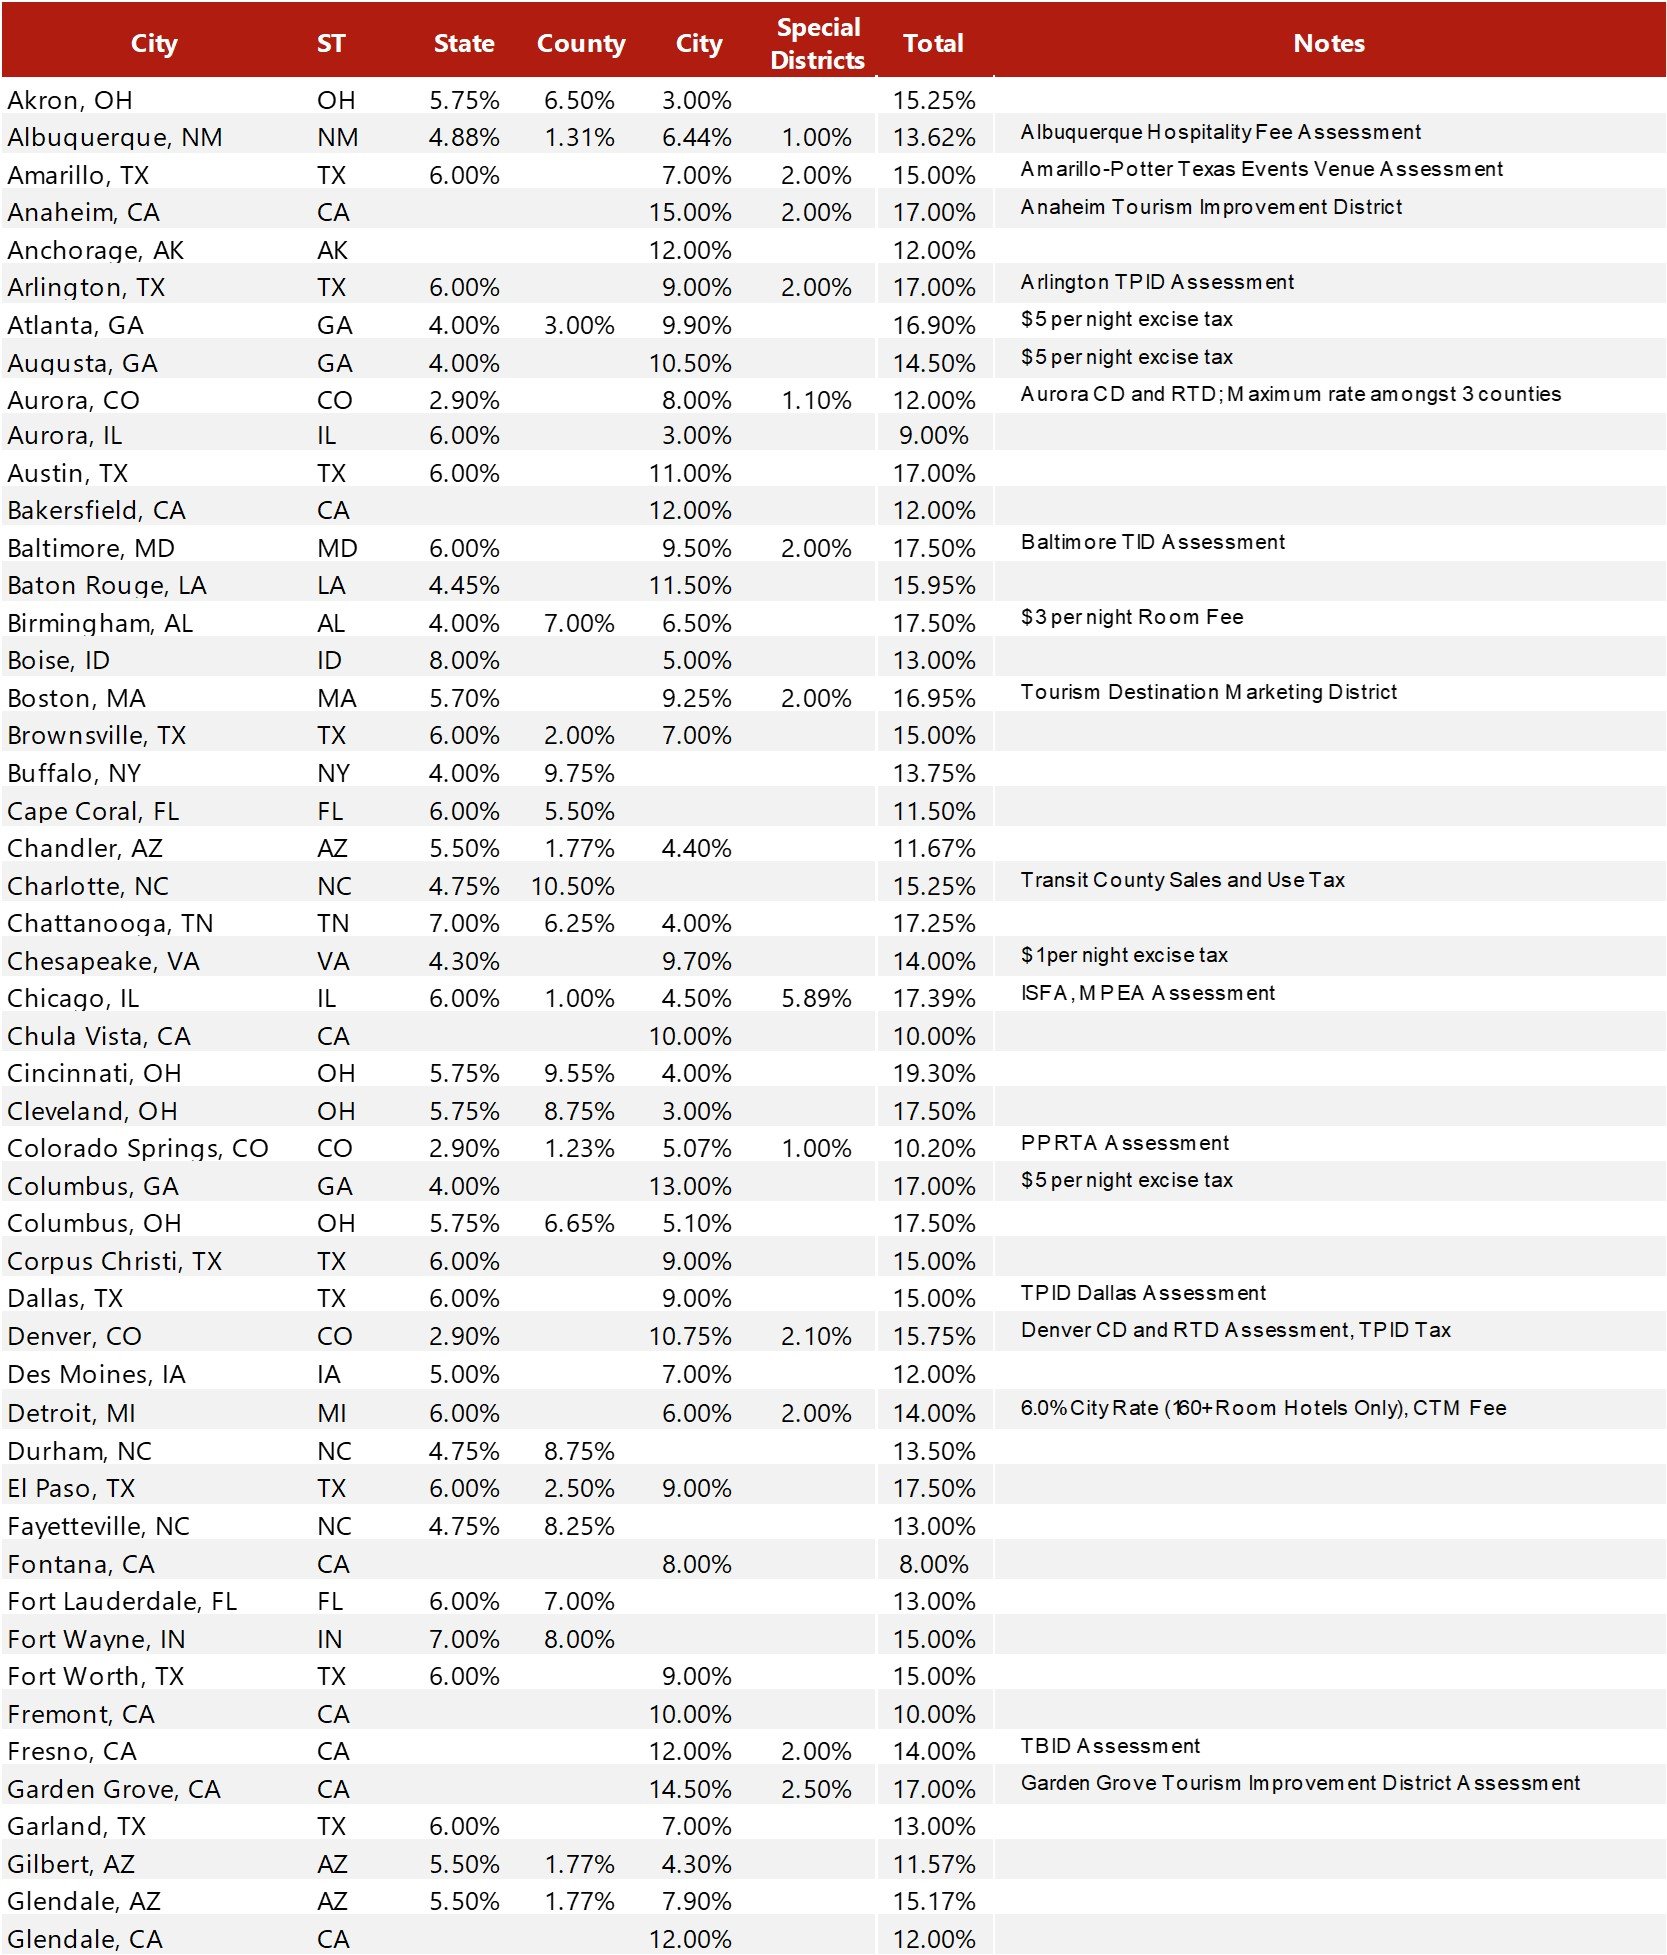
Total Lodging Tax Rates
.jpg)
Source: Respective Jurisdictions
To calculate the special district rate, HVS calculated the tax rate an overnight visitor would pay to stay at the hotel with the highest tax rate within a special taxing district. Due to special taxing districts, the tax rate at a particular hotel can be influenced by its location, size, or other factors that determine tax rates. The figure below shows a distribution of combined lodging tax rates in the 150 largest U.S. cities.
.jpg)
Source: HVS and Respective Jurisdictions
.jpg)
Source: Respective Jurisdictions
Source: Respective Jurisdictions
Tax Rates in Top 150 Urban Centers 2024 - Continued
.jpg)
Source: Respective Jurisdictions
Tax Rates in Top 150 Urban Centers 2024 - Continued
.jpg)
Source: Respective Jurisdictions
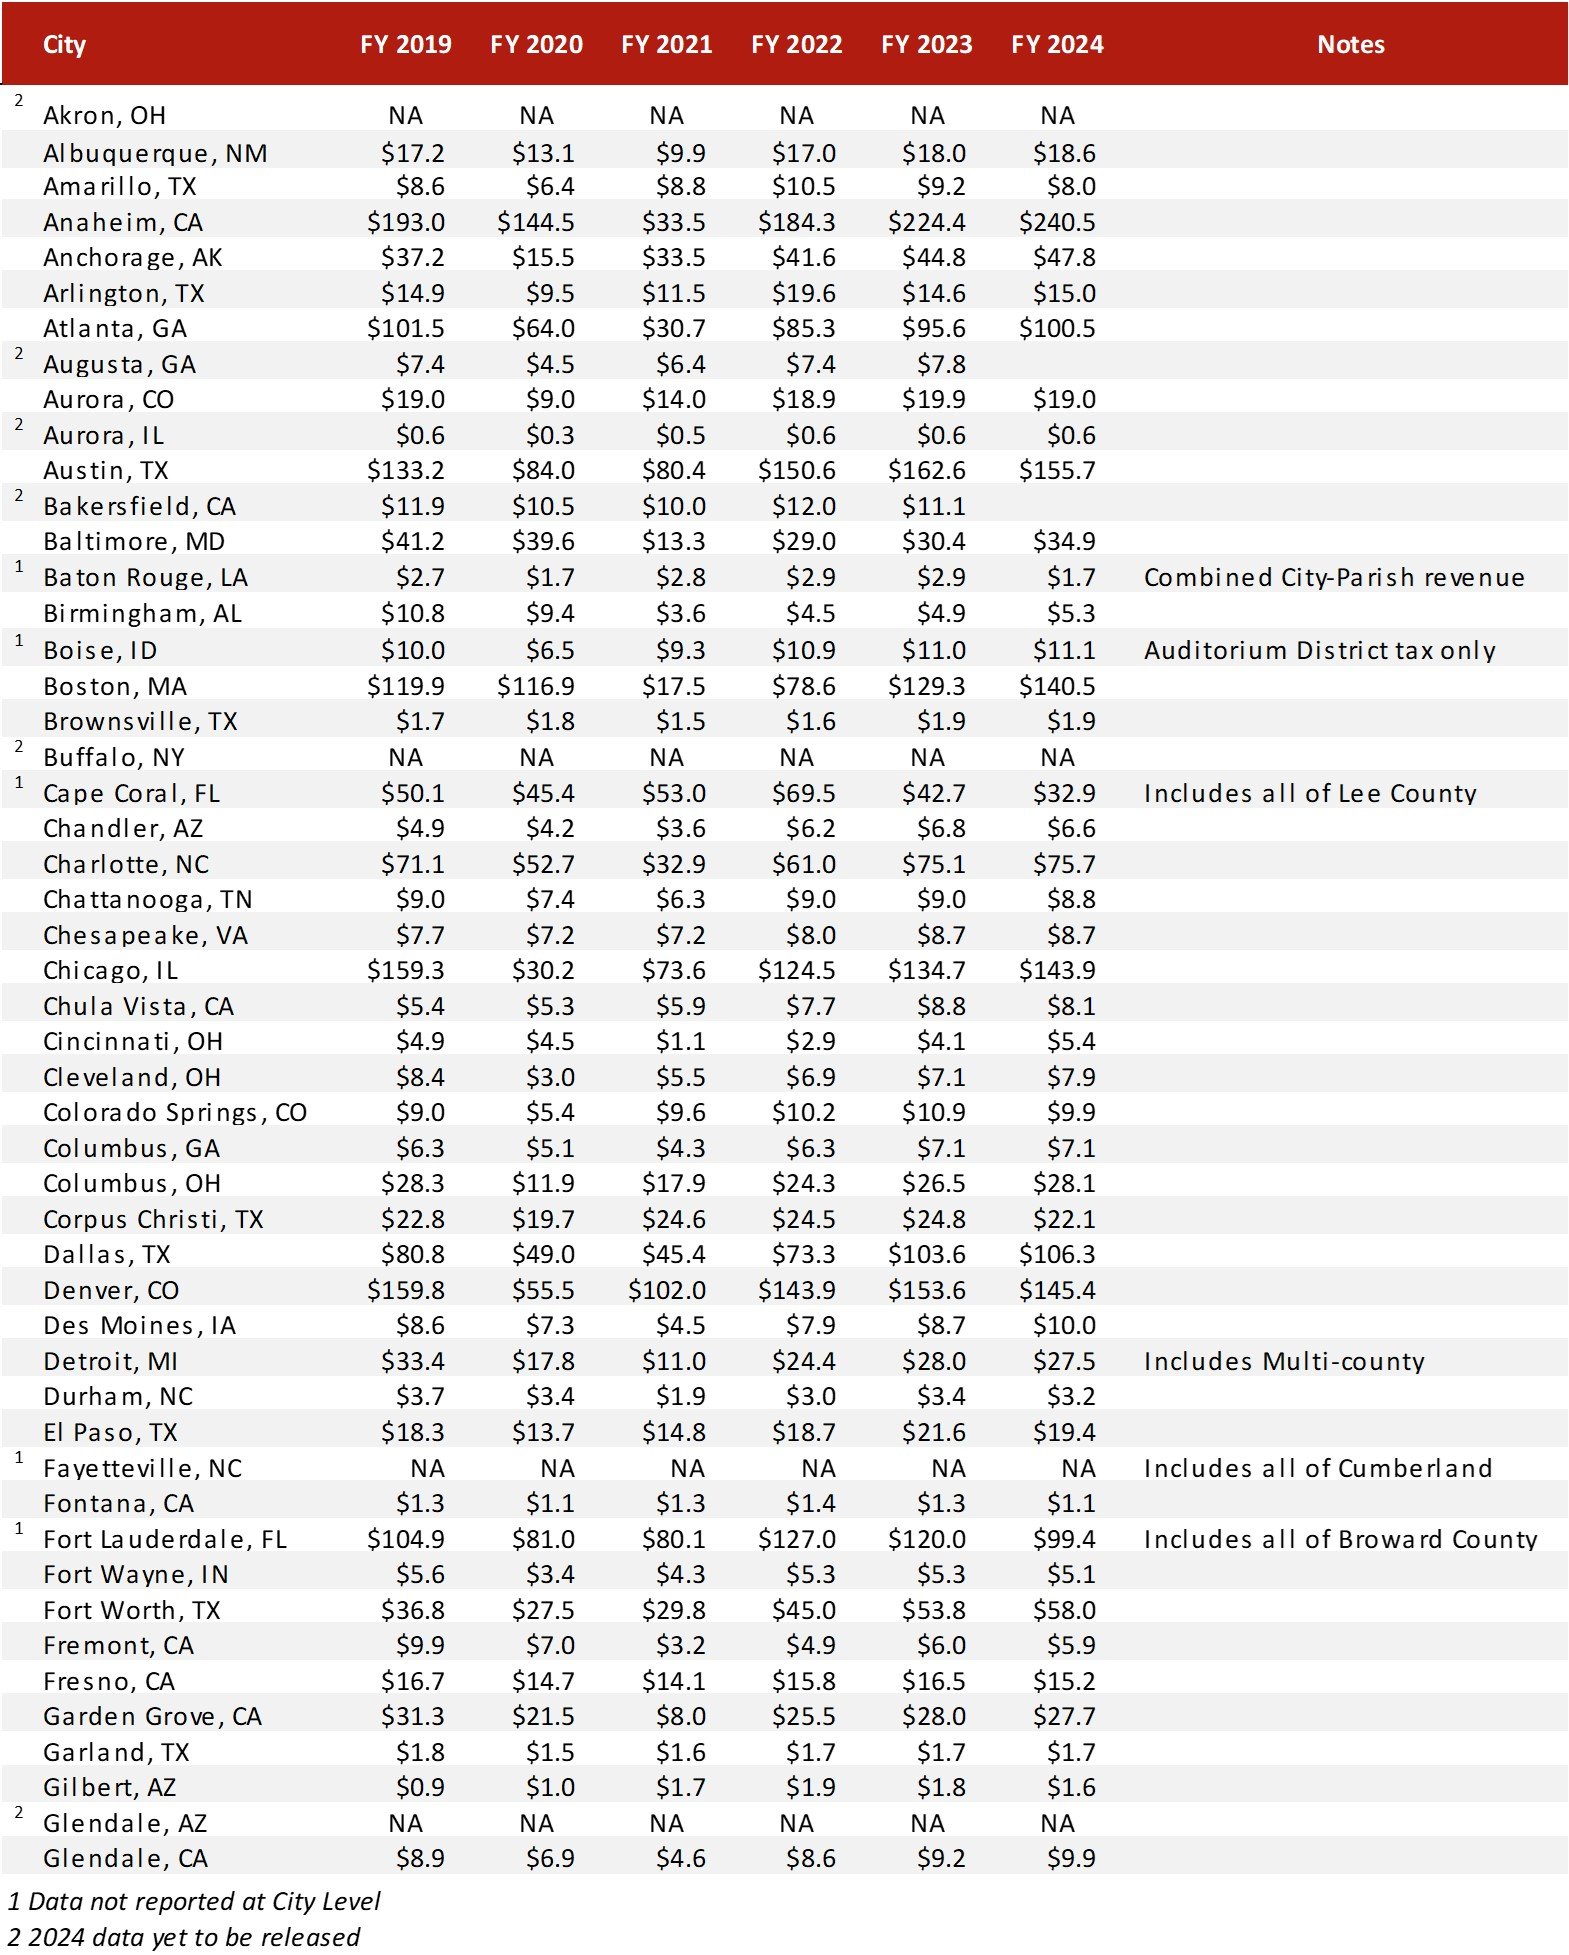
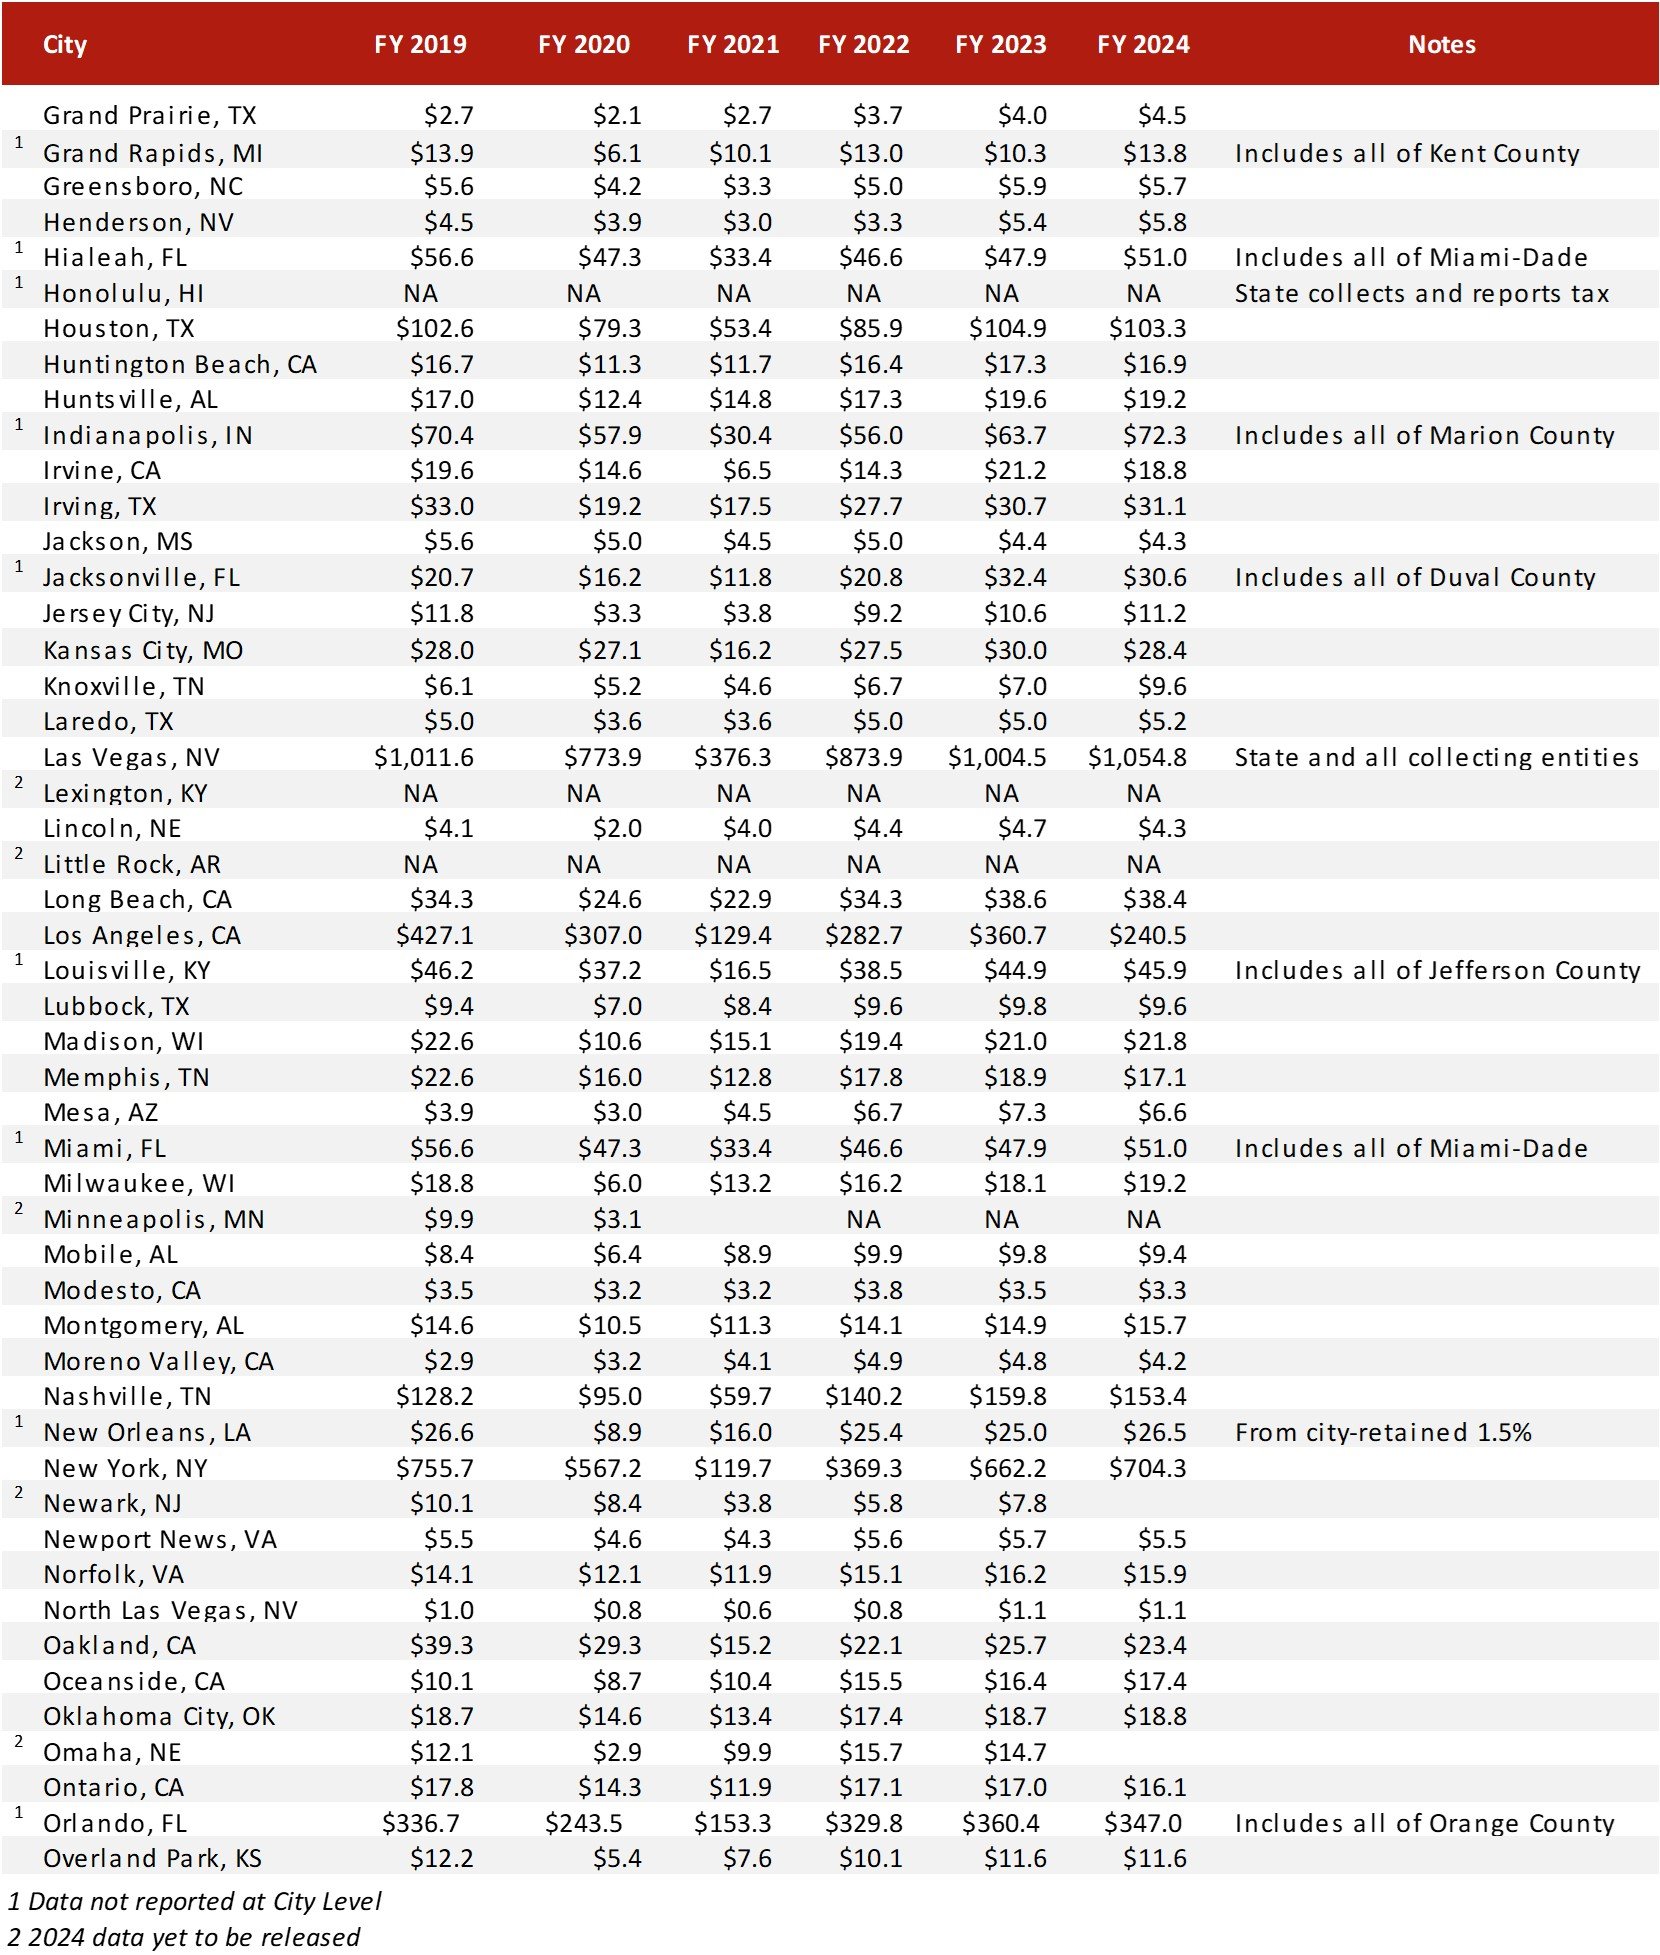
City Lodging Tax Revenue
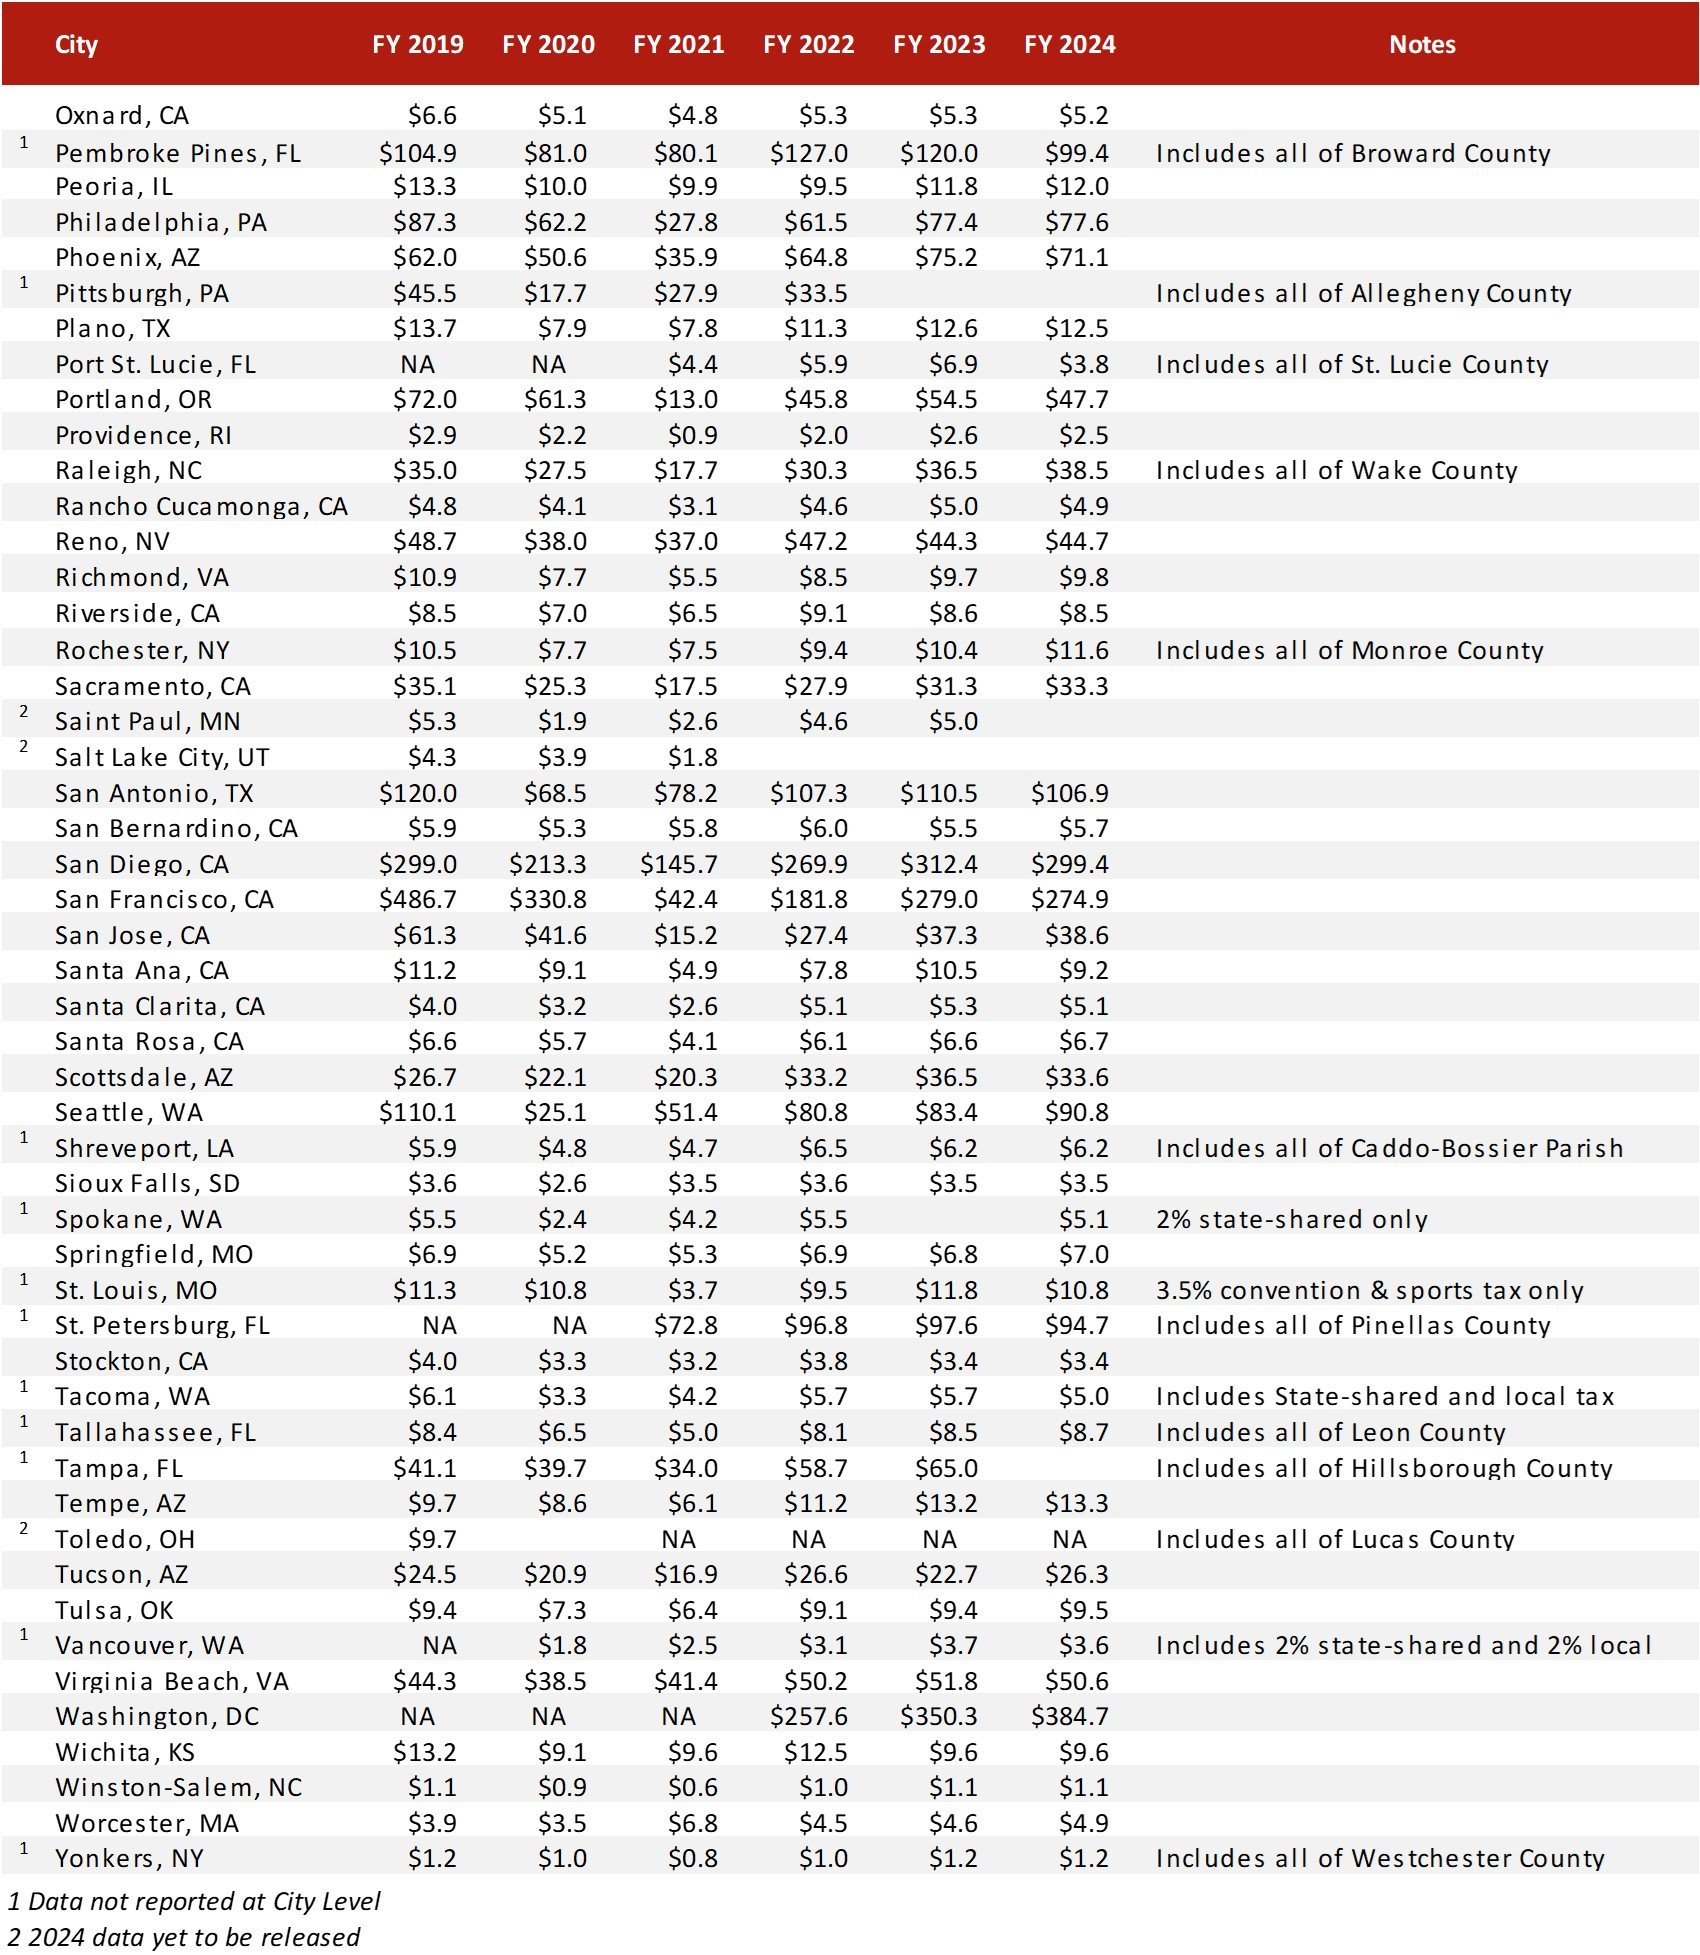
The following tables describe the lodging tax revenue that the 150 most populous cities collected from lodging taxes. Unless otherwise noted, the tax rate and revenue listed only pertain to the citywide lodging tax and exclude special district or city sales taxes. Unlike most lodging tax revenues, sales tax revenues typically flow to general government funds and are not separately reported for the lodging sector.Consequently, the revenue figures presented for comparable cities can diverge greatly. For example, a city in California with an average lodging tax rate will show greater revenue year over year than a similar city in Nevada, where taxes are levied primarily at the state and special district level. For individual cities, revenues are reported from consistent sources each year.
In some states and cities, lodging taxes are imposed by the county rather than the city level. For example, cities in Florida, Indiana, and parts of New York do not levy municipal lodging taxes. In such cases, we list county lodging tax revenues. Year-over-year revenue changes may reflect tax rate changes and underlying changes in taxable receipts for lodging.
Source: Respective Jurisdictions
Reported Lodging Tax Revenues in Top 150 Urban Centers ($ Millions) - Continued
Source: Respective Jurisdictions
Reported Lodging Tax Revenues in Top 150 Urban Centers ($ Millions) - Continued
Source: Respective Jurisdictions
Excise Taxes
In addition to percentage taxes on gross room revenues, some hotels are subject to excise taxes on lodging transactions and may be charged a flat fee per room night. Excise taxes tend to be less volatile because they only depend on occupancy and are not subject to room price variations. However, excise taxes do not grow with inflation or room rate increases.Hotels in 22 cities are subject to a state, city-wide, or special district excise tax. Excise taxes range from $0.75 to $5.00 per room night, with an average of $2.74. HVS calculated each city’s excise tax as a percentage of its per diem rate (in fiscal year 2024 dollars) to estimate effective tax rates. A city’s effective rate indicates the average rate a person pays if the excise tax were included as a percentage of the total sale price. For this example, HVS used the per diem rates set by the General Services Administration (GSA). The per diem rates set by the GSA are usually lower than the average daily rates at hotels in the specified areas. The chart below is for illustrative purposes only.
On average, every dollar charged in excise tax is roughly equivalent to an ad valorem tax increase of 2.04% for 2024.
.jpg)
Source: HVS, GSA, and Respective Jurisdictions
Airbnb Lodging Tax Collections
Short-term home rental services such as Airbnb and VRBO have grown even more popular among travelers, with Airbnb being the dominant player in the market. 2024 marked a record year for Airbnb in terms of revenue, with a total of $11.1 billion, representing a 12% increase from 2023, which had previously set a record. This increase was primarily driven by a 10% increase in the number of bookings. Listings in North America accounted for 45% of 2024’s revenue. Often referred to as part of the sharing economy, these peer-to-peer platforms enable homeowners or hosts to rent out a spare room, an entire house, or an apartment to travelers seeking unique travel experiences and accommodations. Airbnb has experienced exponential growth since its founding. In 2024, Airbnb’s adjusted EBITDA rose 11% to $4.0 billion, reflecting continued strong business performance.In response to Airbnb’s growth, cities have been compelled to address challenges stemming from the impact of short-term rentals. Residents have raised concerns over the neighborhood impacts of transient visitation. In response, many cities and states have imposed new taxes and regulations on short-term rentals.
To gain legitimacy and permanence within the United States, Airbnb has urged local governments to permit it to collect and remit lodging taxes on behalf of its hosts. In the past two years, states and cities have made considerable efforts to collect taxes from Airbnb. Most recently, starting January 1, 2025, a 4.5% short-term rental lodging tax will be imposed in Delaware on all short-term rentals, including those listed on platforms such as Airbnb. Hawaii remains the only U.S. state in which Airbnb does not collect and remit taxes on behalf of the state.
Disclaimer
HVS’s lodging tax study recognizes that lodging tax rates, collections, and distributions are in constant flux. The data presented herein are HVS’s best attempt to gather the most recently available information. HVS used sources deemed to be reliable and assumes that this information is accurate. All questions, comments, or concerns are welcome in the continuing process to accurately present the current and historical trends of lodging taxes in the United States.
[1]Tourism Economics, "US Inbound Travel's Continued Decline Amid Sentiment Challenges", Retrieved October 27, 2025.
[2]Typically defined in ordinances as being fewer than thirty days.
[3]Home rule cities are cities that have their own taxing authority, have adopted home rule charter for their self-governance, and are not limited to exercising only those powers that the state expressly grants to them.
[4]Municipal Finance Journal, "Local Lodging Taxes During and After the Pandemic", Retrieved October 27, 2025.