A capitalization rate (“cap rate”) is a shorthand expression of a given investment’s return and represents the weighted average return to the debt and equity positions. As detailed in this article, hotel cap rates are higher than they’ve been in recent years and are unlikely to decline anytime soon.
Component Parts
A cap rate can be constructed using the “band-of-investment” technique, requiring assumptions as to both debt financing terms and the equity investor’s return requirement, measured by the dividend (cash on cash) rate. The following table identifies this technique using typical pre-pandemic inputs for hotels.Band-of-Investment Technique: Pre-Pandemic
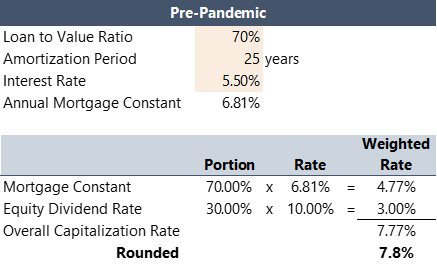
The annual mortgage constant is based on the interest rate and amortization period. The equity dividend rate is difficult to source; it is not tracked in investor surveys or transaction data. But logic dictates that the annual equity return should be materially higher than the debt return due to the higher risk factor.
Loan-to-value ratios for hotels have generally ranged from 50% to 80% over time. Because the debt component tends to account for most of the capital stack, debt costs tend to be the leading indicator for cap rate metrics.
Debt Cost Trends
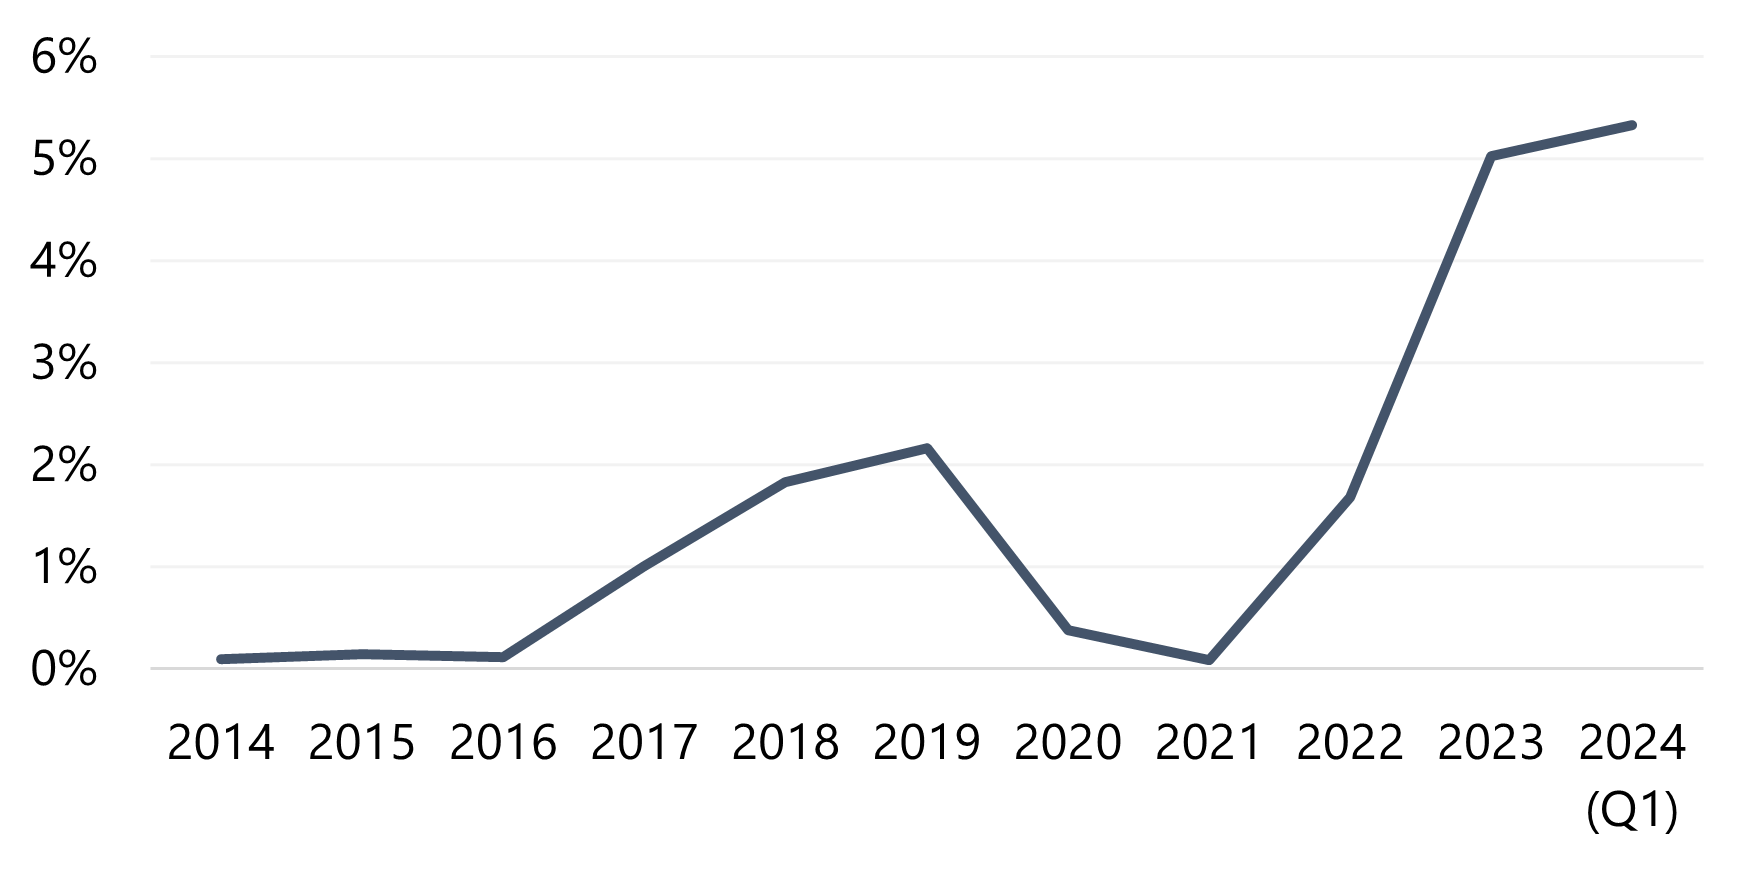
Current hotel debt costs are well above the levels observed in the prior decade and even into the first two years of the pandemic. Debt costs began to increase mid-year 2022 due to the inflation-reduction strategy implemented by the Federal Open Market Committee (“the Fed”) through its changes to the federal funds rate. The following table shows the average annual federal funds rate over the past decade.Average Annual Federal Funds Rate
CPI-U Trends—Year-Over-Year* Changes by Month
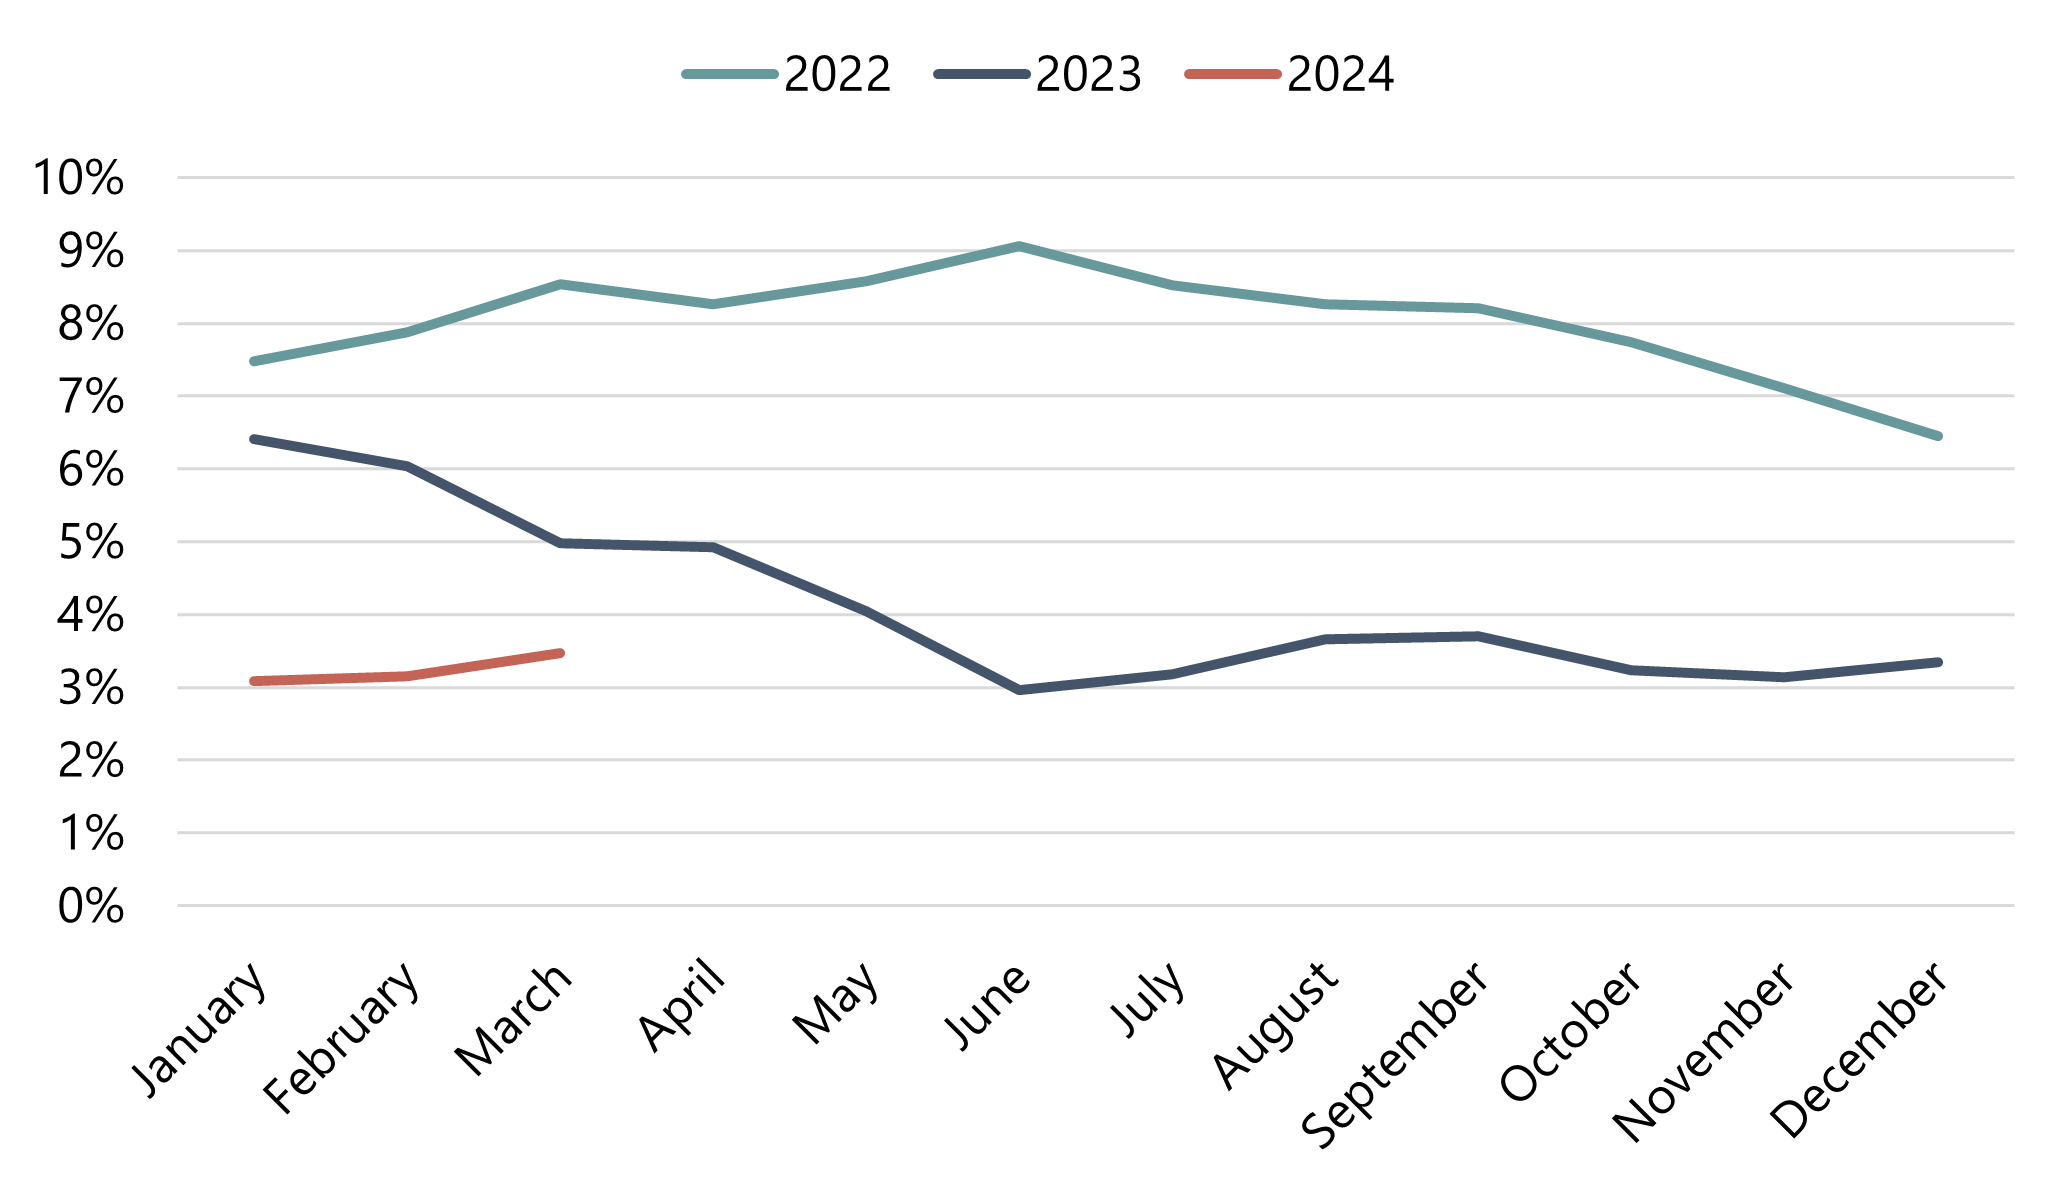
Source: Bureau of Labor Statistics
The following table revisits the band-of-investment technique using debt parameters more typical of the post-pandemic reality.
Band-of-Investment Technique: Post-Pandemic
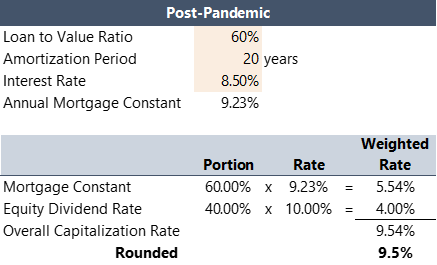
With the increase in the mortgage constant and the decrease in the loan-to-value ratio, the calculated cap rate is 170 basis points higher than the pre-pandemic calculation. With all things held equal, this cap rate increase implies a value reduction of 18%.
The cap rate increase and value reduction factors are more severe than those indicated by surveys and market-derived data. Equity investors have lowered their near-term return thresholds, anticipating an eventual payoff once interest rates decline and the asset is refinanced.
Investor & Broker Surveys
The following table summarizes the results from two surveys of leading hotel investors and brokers with respect to overall, or going-in, cap rates (as opposed to terminal, or going-out, cap rates, an input used in discounted cash flow analyses). The table compares each survey’s current readings with the most recent pre-pandemic readings. The percentage difference in the two readings represents the implied valuation change. As shown above, the survey data illustrate value-loss factors of 3% to 15%, assuming static inflation-adjusted net income. The data suggest that higher-quality assets have been prone to the most significant loss factors. Looking at inflation, the national CPI-U grew by 19% between 2019 and 2023. Thus, if a given hotel’s net income grew by 19% over this period, its value-loss factor resulting from the cap rate increase would theoretically align with the averages for its property type shown above. To the extent that net income growth exceeded or lagged this inflation factor, the value-loss factor would be proportionately higher or lower.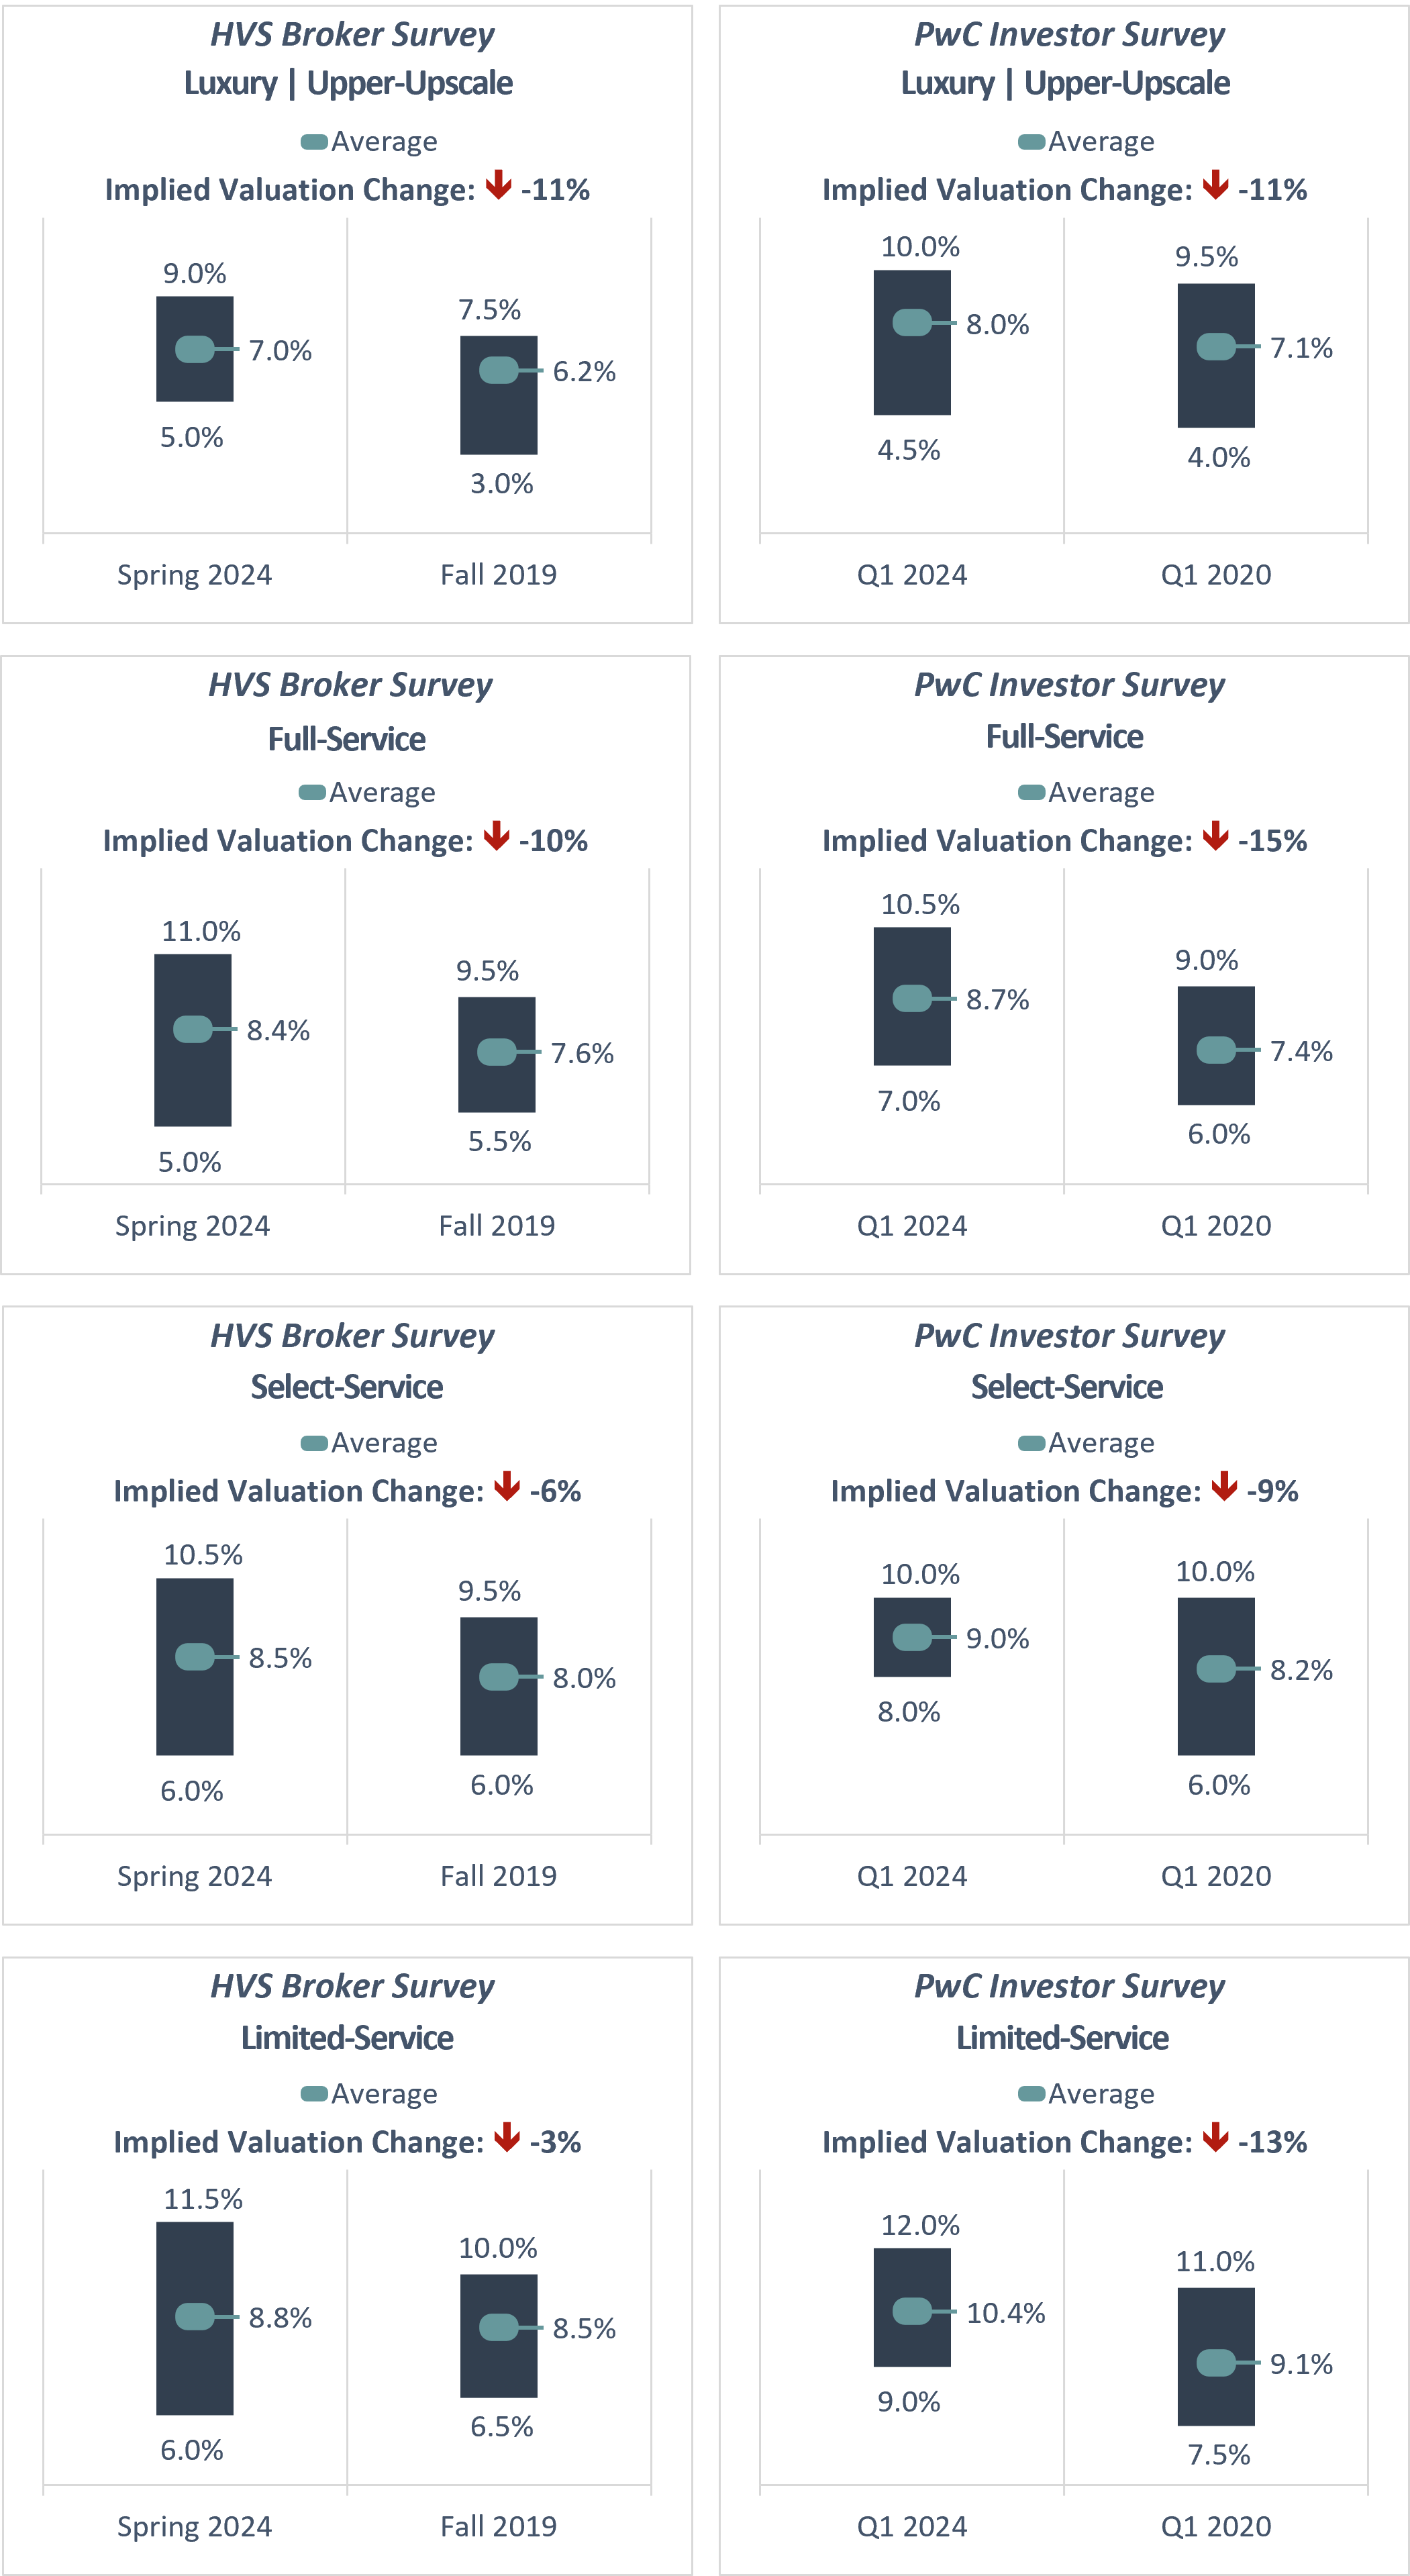
Surveys can be limited by a lack of market activity during slow cycles when few transactions make it to the finish line. Limited market activity means limited data for survey participants to reference. The decline in commercial real estate investment activity resulting from the interest rate increases is well documented. In the hotel sector, sales activity dropped significantly beginning mid-year 2022. The decline coincides with what were otherwise relatively healthy times in the industry. Hotels have emerged as a less risky sector as compared to other types of commercial real estate, particularly office buildings. Nevertheless, higher debt costs have inhibited market activity, with sellers resistant to the value loss implied by higher cap rates.
Market-Derived Cap Rates
Investor surveys are prone to criticism because they are unempirical. They are not necessarily based on actual transactions, per se, and can also be interpreted as representations of desired or target return rates. But cap rates can also be market-derived, i.e., calculated based on actual sales data. Market-derived cap rates are almost always calculated using historical net income as the numerator, ideally from the most recent twelve-month period preceding the sale date. As for the denominator, the sales price alone is almost always the selected input, without any upward adjustment for planned renovation expenditures. However, inflexibility in these inputs can result in illogical cap rates, such as in the following cases.
- In cases where the transacted property has underperformed historically and the winning bidder was obliged to base their offer on a significant income gain, the calculated cap rate will often skew downward. A more correct numerator in such a case is the forecasted stabilized net income, deflated to base-year or year-one dollars. Unfortunately, most buyer income forecasts are treated as proprietary and confidential, making such an adjustment impossible. And the time required to build up to stabilization represents an additional investment cost that is not accounted for with a simple deflation factor, thereby overstating the cap rate.
- Conversely, cap rates can be skewed upward when a “keep-pace” renovation is required (i.e., a renovation necessary for the property to maintain its current market position). In this scenario, the most correct inputs are historical net income in the numerator and the total cost basis (sales price plus renovation cost) in the denominator. Renovation cost estimates are commonly reported, but the upward adjustment to the denominator remains an atypical practice.
With these limitations in mind, the following table illustrates a small sample of cap rates derived from actual hotel sales realized over the past six months. In most cases, HVS appraised the transferred hotel as part of the transaction, and the sale involved a single asset only rather than a portfolio. For the cap rates, we have illustrated two scenarios for each asset. In all cap-rate calculations, we have used the most recent twelve-month historical income results in the numerator. For the denominator, we have used the sales price only and the sales price plus renovation cost, or total cost basis.
Market-Derived Cap Rates: October 2023–April 2024
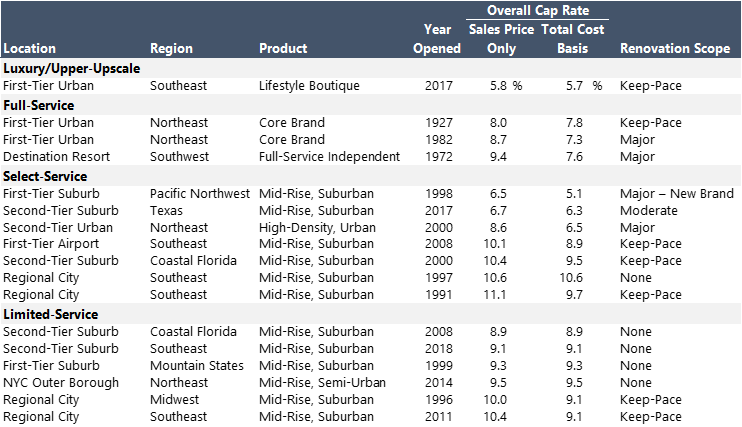
Conversely, in cases where a keep-pace renovation was planned, cap rates calculated based on the sales price alone are likely to be overstated. As illustrated above, six of the transfers indicated cap rates of 10.0% or higher. For five of these sales, a keep-pace renovation was planned. If the renovation cost is factored into the denominator to create a true total cost basis, the cap rate for each transfer falls to the 9.0% to 10.0% range, which more accurately represents buyer perspectives.
Considered broadly, limitations notwithstanding, the indicated results roughly align with the survey findings presented earlier, which is logical considering that most survey participants are directly or indirectly involved with establishing investment parameters for underwriting and valuation purposes. This is perhaps the best argument for survey data reliance.
Conclusion
Compared to other forms of real estate, hotels are idiosyncratic, and the number of variables affecting the acquisition decision are difficult to represent objectively. The simplicity of the “Value = Net Income ÷ Cap Rate” equation belies the complexity of the underwriting process that typically grounds a hotel buyer’s investment decision. Significant factors can include branding/management issues, opaque buyer/seller motivations, and atypical lease encumbrances, to name just a few. In addition, many transactions are part of large portfolio sales, where sales data is only reported in the aggregate. Nevertheless, the metric is useful because of its simplicity, which gives hotel market participants a tool for succinctly communicating a summary view of an acquisition’s economics, as well as changes in the return thresholds required by hotel debt and equity markets over time.As of now, a new reality for cap rates is dawning. The post-pandemic increases in hotel debt costs have pushed cap rates up, which translates to value loss, all other things held equal. As the sluggish investment market shows, the process of reckoning with the new cap rate reality remains a work in progress.