Introduction
After reaching an all-time low in 2020, attributed to the impact of the COVID-19 pandemic, the national lodging market quickly rebounded to an all-time revenue per available room (RevPAR) high in 2022. While occupancy levels in 2022 remained below 2019 levels, ADR exceeded 2019 levels that year, propelled by a combination of inflation and a surge of leisure travel in the post-COVID-19 era. Data for 2023 illustrate that the impacts of COVID-19 are generally behind us and the lodging market has reached a new level of stabilization, with occupancy growth continuing, albeit at a more muted pace, and ADR also illustrating further growth.COVID-19 had a significant impact on hotel supply and construction costs. In 2020/21, aside from projects already under construction, new hotel development virtually came to a standstill due to uncertainty regarding the recovery in economic conditions. For the first time ever, hotel supply in 2020 was reported to have decreased dramatically due to the temporary closure of many hotels. The subsequent reopenings of these hotels in late 2020 and throughout 2021 resulted in an outsized increase in supply in 2021. While a small portion of those supply additions were newly built properties, the vast majority were reopenings of existing hotels. Supply growth normalized in 2022 but is forecast to be minimal from 2023 through 2025 given the increase in construction costs and other development challenges, as described in more detail in this report.
HVS has tracked hotel development costs for over three decades, collecting data from actual hotel cost budgets during our assignments. This 2023 survey reports per-room hotel development costs based on data compiled by HVS from hotel projects proposed or under construction during the 2021 through 2022 calendar years. The data reflect eight product categories: limited-service, midscale extended-stay, upscale extended-stay, dual-branded, select-service, full-service, and luxury hotels, as well as redevelopment projects. Given that this survey provides a retrospective view, lingering supply chain issues and inflationary factors in 2023 may not be fully reflected in the data.
The HVS U.S. Hotel Development Cost Survey sets forth averages of development costs in each defined lodging product category. The survey is not meant to be a comparative tool to calculate changes from year-to-year, but rather, it reflects the actual cost of building hotels across the United States in 2021 and 2022. As will be discussed, the medians and averages set forth in this survey are greatly affected by the types and locations of hotels being developed at this point in the development cycle. Our goal in sharing this publication is to provide a basis for developers, investors, consultants, and other market participants to evaluate hotel development projects. Given that development costs for hotels are dependent on a multitude of factors unique to each development and location, this report should not be relied upon to determine the cost for actual hotel projects or for valuation purposes. Rather, it is intended to provide support for preliminary cost estimates, as well as to show a comparison across the various hotel categories.
Supply-and-Demand Dynamics Affecting Hotel Development
The year 2022 served as another period of recovery and growth for hotel occupancy and average daily rate (ADR). STR reported national year-end 2022 occupancy and ADR at 62.7% and $148.83, respectively. In the year-to-date period through June 2023, the metrics were reported at 62.9% and $154.45, respectively. This equates to a respective 2.3% and 6.2% increase in occupancy and ADR when compared to the same period of 2022. For this 2023 year-to-date period, RevPAR is up 8.7% when compared to 2022, illustrating the resilience and recovery of hotel performance in the post-COVID-19 era.EXHIBIT 1: U.S. OCCUPANCY, AVERAGE RATE, AND REVPAR
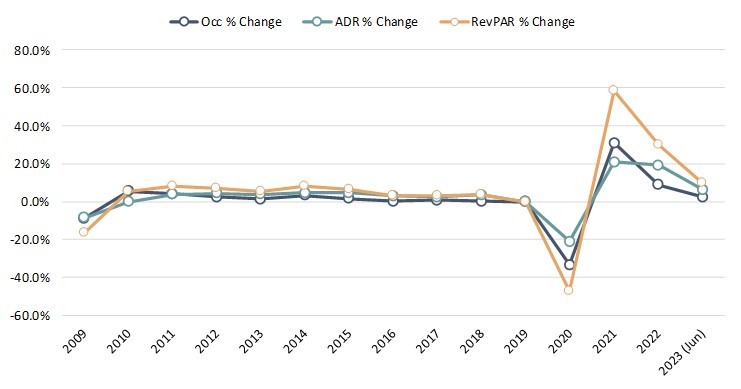 Source: STR
The pandemic affected different markets in various ways. Primary markets, which represent the top 25 cities in the United States, experienced the steepest drops in RevPAR for 2020 compared to 2019, down 58% on average by year-end. In contrast, RevPAR declined 40% in all other markets during the same period. This comes as no surprise, as urban destinations were most affected by the pandemic given their higher reliance on business, group, and international travel.
Similarly, because of this more pronounced impact on urban destinations, the change in supply in 2020 in primary markets was -8.4%, compared to -1.4% in secondary markets, as some hotels had to temporarily suspend operations. However, the most noticeable change in supply occurred post-pandemic. Supply in primary markets grew by 8.3% in 2021 and 4.4% in 2022. In contrast, the change in supply in all other markets was 3.7% in 2021 and 0.7% in 2022. These data show that despite significant interruptions in 2020, new supply has continued to enter primary and urban markets at a higher rate than all other markets. This is likely because most hotel development projects that opened in 2021 and 2022 were planned in or prior to 2019/20.
Going forward, supply increases will likely be influenced by shifts in demand. Secondary markets and resort destinations have been less affected in the post-pandemic era, which means that data in future years may reflect a shift in sentiment or higher interest in developing in these markets, compared to urban destinations.
Based on available data from various sources, the following table illustrates historical supply data, coupled with our forecasts for 2023 through 2025.
EXHIBIT 2: HISTORICAL AND PROPOSED NEW SUPPLY
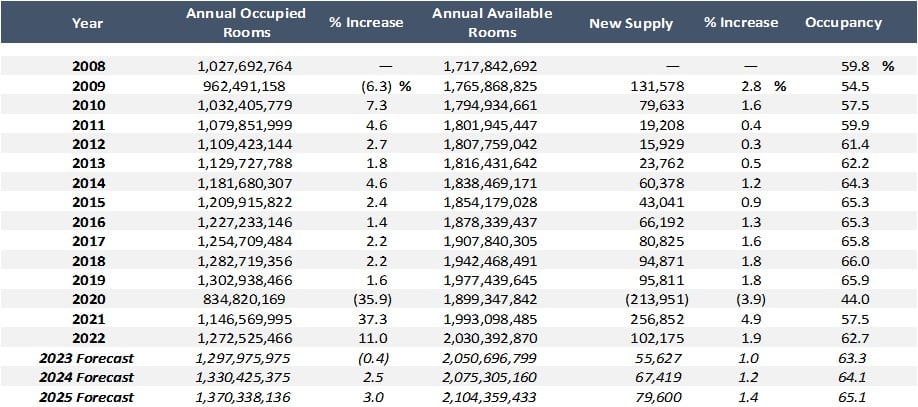 Source: STR, HVS
Supply growth typically lags the market because of the time it takes for projects to become feasible, obtain financing, and be developed. The pace of growth in new supply following the 2009 downturn slowed substantially to an annual average of 0.4% from 2011 through 2013. In the early post-recession years, hotel revenue, net operating income (NOI), and values declined to a level that did not support new construction. Once RevPAR and NOI reached a point supporting feasibility, it took several years for projects to obtain financing and be constructed. The pace of new supply growth more than tripled from that trough to an average of 1.4% from 2014 through 2019, reflecting the resurgence of hotel openings in those years, as illustrated above.
As mentioned previously, supply decreased by 3.9% in 2020 due to hotel closures. This was followed by a rebound of 4.9% in 2021, which represents both the reopening of the closed hotels and the opening of the new hotels that were already in advanced stages of development prior to the construction stoppage. New supply peaked at 1.9% in the most recent data for 2022, representing approximately 102,000 new hotel rooms. However, similar to the dynamic experienced in the post-2009 years, new supply growth is expected to significantly moderate to 1.0%, 1.2%, and 1.4% in 2023 through 2025. Prior to the onset of COVID-19, STR had initially projected new supply to grow by an annual average of 2.0%; however, the impacts of changes in feasibility, supply chain issues, cost of debt, and rising construction costs have reduced the number of hotel developments planned to come to fruition in the coming years.
EXHIBIT 3: CHANGE IN U.S. HOTEL SUPPLY OVER TIME
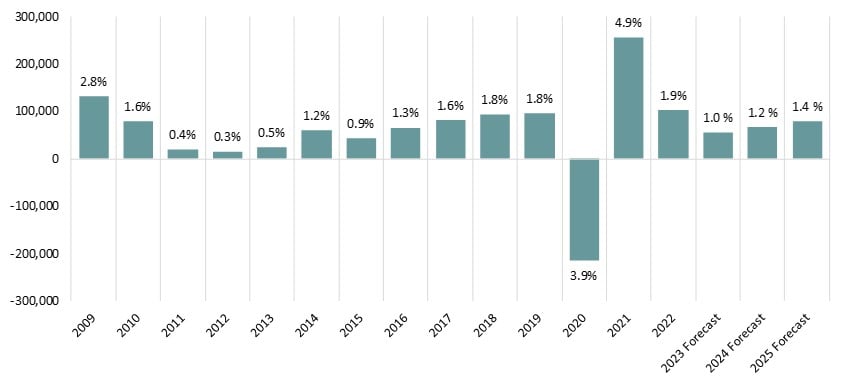 Source: STR (Historical), HVS (Forecast)
While the aforementioned factors pose challenges for new hotel development, many visionary developers remain optimistic during times of crisis. Hotel development can often take three to five years to come to fruition, and as evidenced in the years immediately following the Great Recession, new supply is typically slow to enter the market after a downturn. The limited number of hotels built during recessionary times creates less competition for existing and proposed hotels when the recovery and expansion arrives. Furthermore, projects that are able to open in the subsequent years will benefit from a new wave of demand that inevitably arrives after each cycle. Even if a hotel is not anticipated to open in the next two to three years, a recessionary period is often the best time to move a project forward through the lengthy pre-development process, which may involve market/feasibility studies, entitlement efforts, architecture, design, brand/operator searches, and pre-construction. Moreover, construction costs can often decrease during a period of correction, which could improve project feasibility if developers have the wherewithal to begin their projects during a slowdown.
Construction Cost Inflation
In the wake of the COVID-19 pandemic, construction costs experienced a significant increase. Several factors contributed to this rise, including labor issues, supply chain disruptions, and other related challenges. Initially, labor issues emerged as many construction projects faced labor shortages due to workers falling ill, restrictions on movement, and/or safety concerns. Government financial incentives also reduced the number of individuals willing to enter the workforce. This reduced workforce led to an increase in wages, including overtime expenses, to compensate for the decreased availability of labor.The pandemic also caused disruptions in the availability and timely delivery of construction materials. Lockdown measures, factory closures, and transportation restrictions worldwide led to delays and shortages, increasing the price of materials. The increased demand for certain materials, such as lumber, further exacerbated these issues.
Enhanced safety protocols and hygiene measures were implemented to protect workers from COVID-19, which added additional expenses. Construction companies had to invest in personal protective equipment (PPE) and sanitation supplies and had to modify worksites to comply with health guidelines.
Lastly, the pent-up demand for construction projects post-pandemic contributed to increased competition and higher prices. With delayed projects resuming simultaneously, contractors faced higher bidding prices and increased labor and material costs, resulting in inflated construction budgets.
In terms of inflation specifically related to development costs, below we present information from the Turner Building Cost Index, which has tracked costs in the non-residential building construction market in the United States since 1967. The Turner Building Cost Index is determined by the following factors on a nationwide basis: labor rates and productivity, material prices, and the competitive condition of the marketplace. The index generally increased year-over-year from 2011 through 2019, significantly outpacing inflation from 2013 through 2019. The index grew by 5.0% on average from 2014 through 2019 before slowing to 1.8% growth in 2020 and 1.9% growth in 2021. However, the cost index surged 8.0% in 2022 and increased a further 6.25% in the 2022/23 trailing-twelve-month period ending June 2023.
As an additional point of reference, Rider Levett Bucknall (RLB), which also compiles a quarterly construction cost report, reported a construction cost index increase of 8.3% for year-end 2022.
The annual changes in the Turner Construction Cost Index compared with the annual changes in the Consumer Price Index (CPI) are illustrated in the following graph.
EXHIBIT 5: PERCENTAGE CHANGE IN CONSUMER PRICE INDEX VS. TURNER COST INDEX
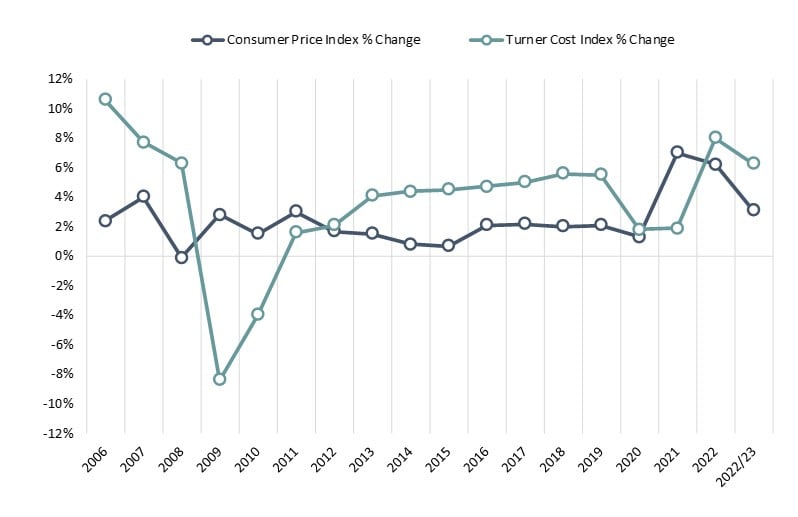 Source: U.S. Bureau of Labor Statistics, Turner Building Cost Index
As shown above, the gap between general inflation and construction inflation narrowed significantly in 2020, with general inflation outpacing construction inflation in 2021; however, the Turner Cost Index resumed its traditional dynamic of surpassing the CPI in 2022. It is important to note that cost growth has been moderating in the 2023 year-to-date period, similar to the decrease seen in the CPI. While labor issues remain a factor, as well as some supply chain issues, costs for certain materials, such as lumber, plywood, and aluminum sheets, have decreased, providing some relief to developers and contractors.
Hotel Development Cost Categories
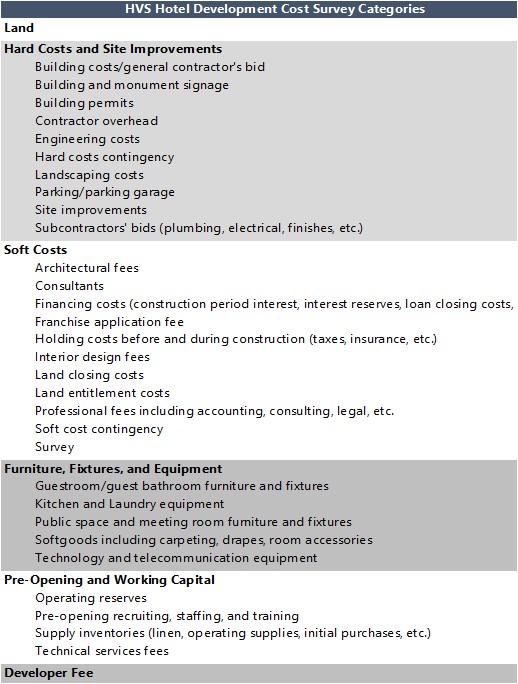
Evaluating the comprehensiveness of a hotel development budget can often be challenging, as different line items are used and some components are unintentionally omitted. HVS has been at the forefront of assisting developers and industry participants make sense of hotel development costs through the consistent presentation of these costs. Based on our experience reviewing actual developers’ budgets, as well as preparing the annual HVS U.S. Hotel Development Cost Survey, we have created the following summary format for hotel development budgets, which forms the basis for the presented cost categories. We find that these categories are meaningful for hotel professionals when undertaking an analysis relating to hotel feasibility, and they provide a basis from which to analyze proposed projects. The following illustration shows the six categories defined by HVS, as well as the typical items associated with each category.EXHIBIT 1: HVS HOTEL DEVELOPMENT COST CATEGORIES
 Source: HVS
The categories are not meant to be all-encompassing but do reflect the typical items in a development budget. In construction accounting, development budgets are commonly presented in far greater detail than for general investment analysis.
Data Collection and Sample Size
HVS collected actual hotel construction budget data across 48 states in 2021/22. While not every construction budget was captured (due to a variety of reasons, including incomplete data, skewed data, or development attributes), our selection includes complete and reliable budgets that form the basis for this year’s survey. The budgets included both ground-up development projects and redevelopments of existing buildings throughout the United States. This year, the states most represented in the survey were Arizona, California, Colorado, Florida, New York, North Carolina, South Carolina, and Texas, illustrating where the bulk of hotel development is occurring in the country. Furthermore, as can be expected, construction costs vary greatly in different parts of the country. In this sample, the highest construction costs on a per-room basis remained in markets with high costs of living, primarily California, followed by New York. However, a number of high-end luxury developments were also noted in Florida and Colorado. Developments with the lowest costs per room included limited-service or economy extended-stay hotels in Sun Belt states.We also examined the lodging product-tier breakdown of our data to further determine the most popular types and brands of hotels that were developed in 2021/22. In the limited-service category, the top five brands were Fairfield by Marriott, Hampton by Hilton, Tru by Hilton, Best Western, and La Quinta. Within the extended-stay category, the top five brands were Home2 Suites by Hilton, WoodSpring Suites, TownePlace Suites by Marriott, Homewood Suites by Hilton, and Staybridge Suites. The select-service segment was most represented by brands such as Courtyard by Marriott, Hyatt Place, Hilton Garden Inn, EVEN Hotels, and Tempo by Hilton. Lastly, the full-service category was most represented by a variety of “collection” brands from Marriott, Hilton, and Hyatt.
Per-Room Hotel Development Costs
The averages and medians below reflect a broad range of development projects across the United States, including projects in areas with low barriers to entry and those in high-priced urban and resort destinations.EXHIBIT 2: HOTEL DEVELOPMENT COST-PER-ROOM AMOUNTS
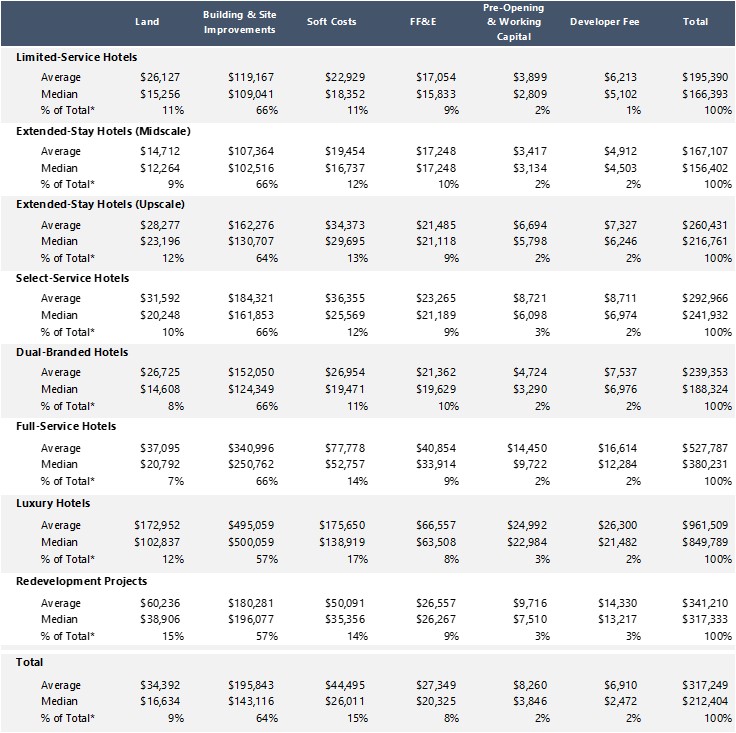
*The percentage of total is calculated based on the total sample of all budgets.
Source: HVS
Limited-service and midscale extended-stay hotels illustrated median costs per room in the $150,000 to $170,000 range and included the popular brands previously highlighted. The median cost for hotels in the upscale extended-stay category was just over $200,000 per room. Dual-branded hotels showed a median of $188,000 given that this category often includes an extended-stay midscale or upscale brand coupled with either a select-service brand or a limited-service brand.Source: HVS
Select-service hotels reflected a median cost of $242,000 per room. The cost to develop full-service hotels is approximately $140,000 per room higher than select-service hotels, with a median cost of over $380,000 per room.
Lastly, the median cost to develop luxury hotels was recorded at nearly $850,000 per room. This category reflected the lowest number of developments given the mathematics of making luxury projects feasible across the country with such high development costs.
It is important to note that the median cost for all hotels increased approximately 20% when compared to the results of our last survey. As mentioned previously, this survey includes data obtained during the 2021 and 2022 calendar years, as compared to our last survey, which included data from only the 2020 calendar year.
In Conclusion
The budgets analyzed in this survey were provided directly by the developers, owners, and lenders on both ground-up and conversion hotel projects during the illustrated period. The results of the survey combine the data from actual construction budgets organized across a variety of product types. The results also comprise unique hotel projects that cannot be replicated by the inherent nature of hotel development. As such, we would caution developers against relying on the information to estimate costs for a specific project, as a multitude of factors affect a hotel’s development budget. Thus, we recommend that users of the HVS U.S. Hotel Development Cost Survey consider the per-room amount in the individual cost categories only as a general guide for that category. Construction and FF&E design and procurement firms are the best sources for obtaining hard costs and FF&E costs for a specific hotel project. It is also advised that developers consult more than one source in their hotel development process to more accurately assess the true cost of development. Additionally, the cost should always be adjusted for inflation over the development timeline given that the typical hotel development process can last three to five years. Lastly, we recommend that the projected performance of the proposed hotel be revisited periodically during the development process.All individual property information used by HVS for this cost survey was provided on a confidential basis and deemed reliable. Data from individual sources, brands, or regions are not disclosed.
Other contributors: Kathryn Lutfy, Koby Kearny, Lizzette Casarin, Astrid Clough McDowell, Stephanie Nettles