An assessment of the accuracy of traditional approaches to valuing the economic contribution of convention, sports, and entertainment venues reveals significant limitations of economic impact models that tend to produce noisy and sometimes biased estimates. Improved methodologies and the effective use of available data sources that address some of these limitations can provide more reliable estimates. Venue owners and destination market organizations need improved methodologies to estimate the return on public sector investment in capital improvements, marketing and sales, and venue operations.
State and local governments invest in capital development, operations, and marketing of convention, sports, and entertainment venues and events to generate positive economic impacts in their communities. Destination marketing organizations (“DMOs”), venue managers, and governments typically measure economic impacts by estimating the spending of visitors imported into their community. In the United States and Canada, public entities require economic impact estimates to justify the use of public funding sources. The traditional procedure, or “spending approach,” to economic impact analysis seeks to estimate a return on investment of lodging and other tourism taxes that provide the primary funding sources. Return on investment is typically measured in terms of new income imported to the local economy, associated job creation, and new tax revenues.
But tracing the path of a dollar of spending in the tourism economy presents a complex challenge for information gathering and economic modeling. This leads to the question of whether analysts generate accurate estimates of economic impact. Many economists are extremely critical of economic impact estimates citing exaggerated and wide-ranging claims about individual projects.[1]
The Spending Approach to Impact Analysis
The output of economic impact models results from multilayered assumptions about the number and type of visitors and the amounts and categories of their spending. The number of new visitors, “heads-in beds,” and the daily spending of visitors attracted by events are typically key inputs. The figure below illustrates a simplified flow of information within an economic impact model.
Figure 1 - Form of a Typical Economic Impact Model
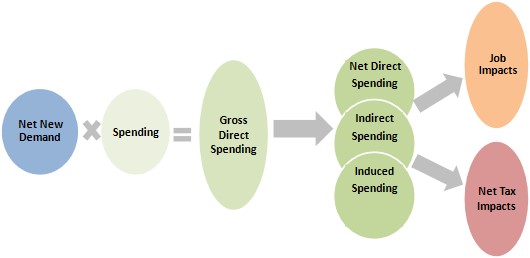
Source: HVS
At best, these models produce rough approximations and noisy estimates of the total spending generated by visitation to events and venues. We know that spending estimates are noisy because different consultants and impact calculators produce widely varying estimates of the impacts of the same venues and events. Even a single consultant may generate a significant variance in estimates when making multiple attempts to model the impact of the same events.
These variations are not necessarily due to a lack of diligence or objectivity on the part of estimators. Rather, wide-ranging estimates are caused by the need to layer many levels of assumptions on top of each other. The formulation of assumptions involves not only the application of objective information but elements of human judgment on how to use available data. A reasonable range of error in estimates at each level of assumption can compound to create large errors in the final estimate.
To evaluate this hypothesis, the author created an impact model that generates a hypothetical annual economic impact of $775 million. The model has nine layers of assumptions needed to estimate the spending of overnight visitors to a given destination. The figure below shows three applications of those assumptions. In two scenarios, estimation errors of plus or minus 10% are applied alternately to each assumption. In Estimate A, a 10% overestimation was applied to the first assumption, a 10% underestimate was applied to the second assumption, and so on for all nine assumptions. For Estimate B, the opposite pattern was applied with a 10% underestimate applied to the first assumption. A third scenario shows a biased estimate of 10% positive error in each assumption.
.jpg)
Source: HVS
The actual economic impact of $775 million is the product of the nine perfectly accurate parameters. Estimates A and B are based on alternating 10% positive or negative errors in each assumption. While a 10% confidence interval is considered a reasonable degree of accuracy in any given parameter, the cascading effect of this acceptable error level results in estimates ranging from 120% more or 82% less than the hypothetical actual in Estimates A and B, respectively. In Estimate C, each of the assumptions has a positive bias of 10%, resulting in an estimated 1.89 times the actual economic impact. Small biases in individual assumptions are likely to produce large biases in overall estimates.
Since all economic impact studies are predictions, we do not know actual impacts, which makes it difficult to distinguish between biased and unbiased estimates. What is interpreted as evidence of bias is sometimes just the result of noisy estimates. It is also difficult for estimators to determine their confidence level in the estimates of the parameters they use in their models. When estimating the impact of events that have already occurred, historical data on the visitation and spending generated by the event may be available. Still, when estimating the impact of future events, the use of historical data may be limited or absent altogether. In the latter case, errors in estimates can easily exceed a statistically acceptable 10% confidence interval.
To estimate the level and pattern of noise that may be involved in unbiased economic impact estimates, the author returned to the sample economic impact model shown in the figure above and applied errors that fell within the range of plus or minus 25% to each of the nine assumptions. The error terms were randomly applied to each parameter in 15,000 trials. The estimates are unbiased because the average error in the estimate of each of the parameters is zero. The figure below shows the distribution of the errors in the overall estimates of economic impact.
Figure 3 - Distribution of Random Errors
(+ or – 25%) in 15,000 Trials
.jpg)
Source: HVS
The error in estimates is not normally distributed. The degree of asymmetry or skewness [2] tends to be negative (approximately –1.4). That is, unbiased random errors in each of the nine parameters result in more underestimating than overestimating economic impact. Only 35% of the estimates fall within a reasonable range of plus or minus 10% of the actual hypothetical impact. At the extremes, approximately one out of ten estimates produce an error of plus or minus 50% or more.
While illustrative, the sample model described in this paper is simpler, with fewer parameters, than most impact models. Many impact models attempt to measure the impact of multiple types of visitation that, in addition to overnight visitation, may include day-trip visits, exhibitors, organizers, sponsors, and others that may bring new income into a destination. Multi-year forecasts also include assumptions about how visitation may change yearly and about inflation and changes in other economic factors. As this model demonstrates, as the number of parameters in the model increase, the potential error in the overall estimate of economic impact increases.
Limitations of the Spending Approach
The spending approach to economic impact tests the limits of our ability to accurately measure the change in economic output caused by venues and events. The assumptions used in economic impact modeling are prone to error because of the difficulty of obtaining accurate information. Some common methodological shortcomings compound the errors resulting from incomplete data. Following is a discussion of five important limitations of traditional economic impact methodologies.
- FIRST LIMITATION – INACCURATE COUNTING. Economic impact estimates start with historical or future visitation estimates, such as the number of event attendees, organizers, or exhibitors. Venue managers and DMO statisticians gather counts of the visitors, attendees, attendee days, overnight guests, and other generators of economic impact. Attendee counts may rely on reports of registered attendees from event organizers, but organizers typically have little information about how long their delegates stay in a destination. Counting room nights is extremely difficult because the information is not accessible on all the booking channels that event attendees may use. At best, room night counts only consider the room nights “picked up” from a reserved hotel room block. Most often, only data on the size of the room block for each event on peak nights are available. The limited ability to count visitation leads to inaccuracies in the critical first-level assumption.
- SECOND LIMITATION – INABILITY TO PREDICT CONSUMER BEHAVIOR. A typical economic impact model includes parameters describing the amounts of spending by attendees, organizers, and exhibitors plus the share of spending on hotel services, transportation, food and beverage, entertainment, and other categories of spending. These assumptions often rely on consumer surveys, which involve self-reporting by event participants rather than an exact accounting of their expenditures. Survey subjects may not be a representative sample of the actual cohort of event attendees. Analysts often rely on data from national or regional surveys that may or may not reflect the profile of visitor spending to a specific destination or event. National survey results can be adjusted to reflect price levels in the local economy, but this builds another layer of assumption, adding to the variability and uncertainty of results.
- THIRD LIMITATION – THE USE OF AVERAGES. By necessity, economic impact models use averages: average attendance, average number of room nights per attendee, average daily hotel room rates, average restaurant spending, and so on. Averages may work well if the distribution of actual spending is normally distributed around the mean. But analysts have little knowledge of the actual distribution of spending and whether it is skewed or highly influenced by outliers. Events vary greatly with respect to the disposable income attendees bring to the event. To use an extreme example, the income of attendees to the World Economic Forum in Davos, Switzerland, is quite different from the income of Comicon attendees in San Diego.
- FOURTH LIMITATION—FAILURE TO CONSIDER THE DISPLACEMENT OF EXISTING ECONOMIC ACTIVITY. This failure is most evident in estimates of construction impacts. The funds for construction spending come from the proceeds of an equity investment or debt issuance. Investing in any given project foregoes or displaces investment in alternative projects. The return on investment generates new income rather than the investment itself. At best, construction activity directs spending and job creation to a specific constituency or geographic area rather than creating new jobs or new spending. Operations of events and venues can also displace economic activity. For example, when a large convention fills a city’s hotels and restaurants, other groups and transient visitors may not be able to obtain reservations.
-
FIFTH LIMITATION—STATIC MODELS FOR DYNAMIC ECONOMIES. This limitation pertains to the Input-Output Models used to estimate indirect and induced economic impacts. Input-Output Models estimate the “multipliers” or follow-on business and personal spending caused by the new direct spending. Setting aside the problem that many analysts are not professionally trained and do not use these models well, the models themselves may not accurately reflect the actual behavior of the local economy. Input–Output models use historical Census Bureau data that quantifies levels of economic activity and employment in each sector of the economy. They posit that if an output changes in Sector A (say the hospitality sector), the output in Sector B (say transportation) increases, which in turn changes the output in Sector C (say automotive) and several other sectors. These relationships are modeled for over 500 sectors in an incredibly complex set of overlapping impacts. As the follow-on spending flows through these models, the impacts of an event or set of events on the economic sectors distant from the original direct spending may become so diluted that the estimates have no statistical significance. As an example, a visitor impact model may estimate insignificant changes in employment in the mining sector. Several hundred insignificant estimates may add to a material impact on the overall estimate
Input-Output Models measure the increase in demand or output of the tourism sector and assume no capacity constraints.[31] But the lack of consideration of capacity constraints provides an incomplete representation of the dynamics of the entire economy. If, for example, labor markets have reached full employment, new direct spending in the tourism sector is likely to increase wages rather than create new jobs. Other sectors of the economy, facing increased labor costs, may contract due to increased tourism. But Input-Output models do not consider potentially negative effects and therefore tend to overestimate the net economic impacts.
Furthermore, Input-Output Models are based on historical US Census Bureau estimates of sector-specific employment, output, and income for years preceding the current year of estimation and well before any projected years of impact. But economies are dynamic. They change yearly and from season to season within a year. If visitation has a significant impact, it should change the dynamics of the economy and the interrelationships between the sectors. These changes are not accounted for in static Input-Output Models.
These limitations add up to a great deal of noise in economic impact estimates and call into question our ability to accurately measure the economic impact of events.
Noise Reduction through Improved Methodologies
Improved methodologies and better use of big data can address some of these limitations and improve the accuracy of estimates. Forecasters need to focus on reducing the number of parameters used in their models and reducing noise in each parameter. Following are six recommendations for improving accuracy.
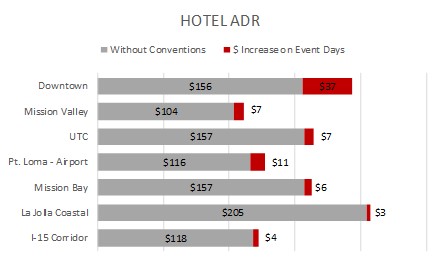
- STATISTICAL ANALYSIS OF RELEVANT DATA SETS—Rather than counting visitation, statistical analysis of data from periods with and without events can produce reliable predictions of net new visitation and indicate the level of confidence one may have in the estimates. A difference of means test [4] is one such example of a statistical approach that avoids counting. For example, HVS performed such an analysis to estimate the hotel room revenue impact of events at the San Diego Convention Center (“SDCC”) on all hotels in the City of San Diego.[5] HVS obtained multi-year data on daily hotel average daily room rates (“ADR”) and occupancy for seven submarkets in the San Diego area. This data set was matched with data on the days a significant event occurred at the SDCC. The figures below compare the hotel occupancy and ADR on SDCC Event Days and non-SDCC Events Days.
Figure 4 - Difference of Means Test
Impact of SDCC on City of San Diego Hotel Sub-Markets
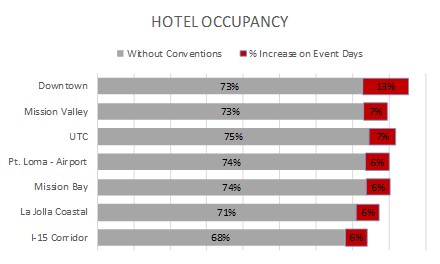
Source: HVS SDCC Convention Center Expansion Analysis
The results show that when the SDCC had an event, downtown occupancy increased by as much as 13% and by 6% or 7% in other sub-markets. The ADR increased by as much as $37.00 on convention center event days in downtown San Diego and as little as $3.00 in the least affected sub-market. A difference of means test also provides information on the reliability or level of confidence in the estimate. In this example, the results for all sub-markets had a less than 1% probability that these differences were caused by random variation in the data.
Using the difference of means tests, HVS has estimated the dollar amounts of impact convention centers have on hotel room revenues in several US cities. The results show how convention centers compress the hotel market and have a ripple effect of increasing room revenues throughout the entire market. This statistical method avoids three limitations of a traditional approach: 1) inaccurate counting of visitation, 2) uncertain estimates of consumer spending, and 3) failure to account for displacement of existing economic activity.
- USE BIG DATA—The use of big data provides a means to avoid counting visitation levels. Several services such as Placer.ai, Arrivalist, Foursquare, and many others provide locational data gathered from mobile phone devices. Starting from a “panel,” or a sample of available phones, these services use algorithms and machine learning to estimate visits and visitors to destinations. They may also provide information on the economics and demographics of visitors, such as income levels, gender, and ethnicity. The following figure shows an example of locational data on daily visitation to the David L. Lawrence Convention Center in Pittsburgh.
to the David L. Lawrence Convention Center
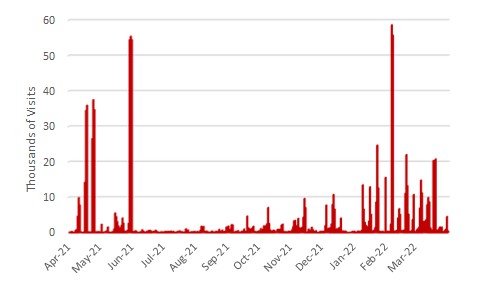
Source: Placer.ai
In addition to these estimates of total visitation Placer.ai generates estimates of the average length of visit (1.97 days), the dwell time (3 hours and 45 minutes), the origin of visitors (30% came directly from home), and the peak days for visits (Saturday and Sunday). Demographic data on visitors is also available, but analysts should recognize the estimates generated by these services involve extrapolation from a small panel to a larger population. In this case, the panel size was 22 thousand, or 4% of the number of estimated visitors. The reliability of these estimates depends on how representative the panel is of the total population. Analysts should not place blind trust in these sources. They should perform reasonableness checks on the estimates they provide.
- SIMPLIFY ECONOMIC MODELS—Research on the accuracy of prediction models shows strong evidence that simple models outperform more complex models.[6] While this may seem counterintuitive, research shows that the noise in expert judgment results in less accurate predictions than simple formulas or rules-based models. In the case of economic impact models, the analysis in this paper shows that the multiple layers of noisy assumptions exaggerate errors in the total impact estimates. Simpler impact models with more accurate assumptions will outperform more complex models. For example, instead of estimating the share of event attendees that need overnight accommodations, one could rely on data that only shows the change in overnight visitors when an event occurs. In the model shown in Figure 2, starting with an estimate of the number of overnight visitors using statistical analysis would replace five parameters that are all subject to error.
- USE MORE NARROWLY DEFINED PERFORMANCE INDICATORS—The standard industry approach to economic impact analysis combines estimates of direct, indirect, and induced impacts because this approach produces the maximum estimate of return on investment. But, as previously discussed, indirect and induced estimates are generated by opaque models that are not well understood by many analysts who use them and less so by public officials and constituents that rely on their results. As shown in this paper, Input-Output models are likely to generate large errors in estimation. Narrowly defined performance indicators that demonstrate substantial return on investment can be more accurately predicted and better understood. For example, justification of the investment of lodging tax dollars in a convention center project could be based on the net-direct spending of visitors or more simply on the new hotel revenue generated by the project. These estimates can be bolstered by the knowledge that other spill-over effects occur without the requirement to produce specific estimates of those other impacts.
- AVERAGE MULTIPLE ESTIMATIONS—Using a “wisdom of crowds” approach, averaging the results produced by multiple analysts is likely to produce more accurate estimates. This works because unbiased estimates fluctuate above and below the mean, and the aggregation of unbiased estimates regresses toward the mean. But this approach only works if there are a sufficient number of independently generated estimates, which is often not the case in impact estimates. But estimates of individual parameters, such as spending per visitor, could be averaged from the findings of multiple surveys and experts.
- PROVIDE SENSITIVITY ANALYSIS—Acknowledging the uncertainty in economic impact estimates and providing a range of results can enhance the credibility of results. Analysts should provide their clients with a sensitivity analysis that shows the impact of the uncertainty associated with the values of the parameters used in their models. With an understanding of the confidence intervals of each assumption, analysts can produce a range of reasonable estimates and demonstrate how sensitive the findings are to changes in key assumptions.
Conclusion
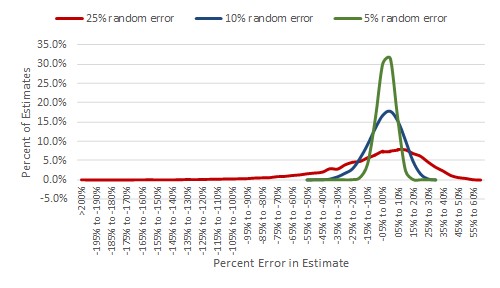
The application of noise reduction techniques can exponentially improve the accuracy of economic impact estimates. Returning to the sample model shown in Figure 2, a reduction of random error in estimates of individual parameters from plus or minus 25% to plus or minus five or ten percent dramatically improves the accuracy of the impact estimate, as shown in the figure below.
Source: HVS
The reduction in random error in the parameters improves accuracy and normalizes the distribution of error. The effects are dramatic.
Source: HVS
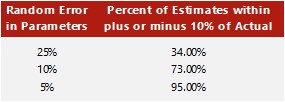
Variations on the example model used in this study show that if noise reduction techniques reduce the random error in the estimate of parameters to 10%, 73% of economic impact estimates would fall within a reasonable range of plus or minus 10%. A smaller random error of 5% would produce reasonably accurate estimates 95% of the time.
Because they rely on these estimates to foster continued support of public sector investment in their projects, venue owners and destination marketing organizations need and deserve improved accuracy.
[1]Baade, R. A., & Matheson, V. A. (2001). Home run or wild pitch? Assessing the economic impact of major league baseball’s All-Star Game. Journal of Sports Economics, 2(4), 307-327.
[2]Skewness is a statistical measure of how much a distribution deviates from a perfectly symmetrical normal distribution.
[3]Evaluating Tourism’s Economic Effects: New and Old Approaches, Dwyer, Forsyth and Spurr, Tourism Management 25 (2004) 307-317.
[4]The difference of means analysis tests the null hypothesis that there is no significant difference between the means of two groups. Rejecting this null hypothesis indicates that differences in the means are probably not due to chance.
[5]Convention Center Expansion Analysis—San Diego Convention Center, HVS Convention, Sports & Entertainment Facilities Consulting, April 2017.
[6]Noise: A Flaw in Human Judgment, Kahneman, Sibony, and Sunstein, Little Brown Spark, 2021, pps.111-136.