Introduction
The COVID-19 pandemic has dealt a bigger blow to the lodging tax revenue stream than any previous event of economic dislocation in US history. Lodging taxes provide a critical source of support for the convention and tourism industries. Lodging tax revenues fund debt service for the construction of convention centers, arenas, and other public assembly facilities. This revenue source provides a large share of the funding for destination marketing organizations (“DMOs”) and covers the operating deficits of convention center venues.The complete picture of how the COVID-19 pandemic impacted the tourism industry will not be completely understood until after the discovery of an effective vaccine or some other mitigation. Furthermore, the economic fallout from the pandemic is likely to last for years. This report provides HVS’ updated forecast for the impact of COVID-19 on lodging tax revenues based on currently available data and on assumptions about the pattern of recovery.
COVID-19 Impact on the Lodging Industry
The hospitality and tourism industries have proven to be the most vulnerable of industries to the COVID-19 pandemic with percentages of revenue losses far exceeding that of the overall economy. The Bureau of Economic Analysis showed a 31.7% decline in real GDP during the second quarter of 2020.[1] The Congressional Budget Office projects annual GDP growth for real GDP to fall by 5.6% in 2020.[2] By comparison, projections of travel industry losses are greater than overall decreases in GDP. An Oxford Economics study from April 2020 projected an 81% loss in travel industry revenue in April and May 2020—with losses continuing through the rest of the year—and a decline of 45% of the travel industry’s contribution to US GDP for the year 2020.[3] In June 2020, U.S. Travel Association and Tourism Economics revised their forecast to estimate $505 billion in losses and $81 billion in lost federal, state, and local taxes by the end of 2020.[4]Federal aid to the hospitality and tourism industry, thus far, has provided some direct aid to private sector partners and owners of properties affected by the pandemic, primarily through Small Business Administration (“SBA”) loans and grants, but these programs have ended and they did not cover the extreme industry-wide financial losses. As of this writing, an agreement on additional stimulous legislation remains stalled. The U.S. Travel Association, in tandem with Tourism Economics, projects cumulative losses since the beginning of March totaling $360 billion for the travel industry.[5] Estimates of the quantifiable effect of COVID-19 on the industry vary; however, the common thread of these projections show an industry at risk. The federal government provided roughly $274 billion in aid to state and local governments in the CARES Act.[6] But most of that aid was directed at paying for COVID-19 pandemic response and could not be used for revenue replacement. As of this writing, there has been no legislative progress on an economic relief package and it appears unlikely that an any such legislation will be approved until well after the US election.
Lodging Tax Loss Forecast
We combined data on lodging tax collections with projections of the performance of hotel markets in 25 major US cities. Before the onset of the crisis, during fiscal year 2019, 25 major US markets generated approximately $3.7 billion in lodging tax revenue as shown in the figure below.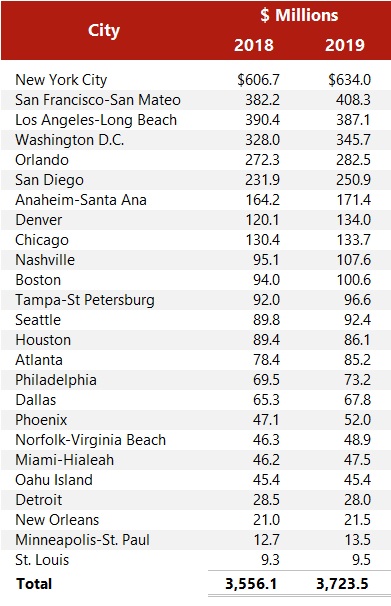
In a base-case scenario without the pandemic, and based on STR estimates of revenue growth, HVS projects that these 25 markets would have generated nearly $3.72 billion in lodging tax revenues in 2019.
The performance of the 25 markets during prior economic shocks, provides an indication of how the recovery from the COVID-19 pandemic may play out. The figure below shows the average daily room rate (“ADR”), occupancy rate, and revenue per available room (“RevPAR”) for the major US markets from 2000 to 2019.
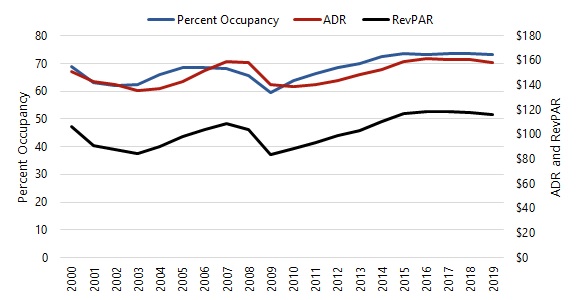
RevPAR, the product of average daily room rate and occupancy rate is a standard industry metric that combines the effects of occupancy and average daily room rate changes on hotel revenue performance. Hotel markets show a high degree of volatility during economic downturns, with sudden decreases and gradual recoveries. For example, RevPAR (adjusted for inflation ) in the US urban markets reached a low point of $83.98 in 2009 during the Great Recession but exceeded pre-recession levels by reaching $110.40 in 2014, a five-year recovery period.
The monthly percent change in RevPAR from the prior year for the US urban markets shown in the figure below demonstrates the patterns of recovery in the aftermath of the 2001 recession and the 2008-09 economic crisis.
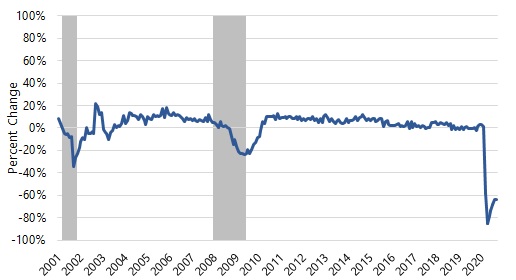
The recovery from the 2001 recession appears V-shaped, a relatively fast rebound from the nadir of the recession. The recovery from the Great Recession was U-shaped, as RevPARs continued to decline at a constant rate for many months before the recovery began. Year-to-date data on the weekly performance of the major urban US markets shows an unprecedent percentage drop in RevPAR.
To address the uncertainty surrounding the path of recovery, HVS relied on the following assumptions for its forecast.
.jpg)
.jpg)
Sources: STR and HVS
.jpg)
To estimate lodging tax revenues, HVS applied the estimated RevPAR growth rates to lodging tax revenues. These RevPAR growth rates capture the combined changes in room night demand and average daily room rates. HVS also factored in hotel room supply growth. Hotel projects already under construction or in the pipeline may come online during the downturn.
The following tables show the forecasts of lodging tax revenues in the 25 US cities analyzed in this report.
Forecasted Effect on Lodging Tax Revenues
.jpg)
Source: HVS
From 2020 through 2025, lodging tax revenues in the 25 major markets are estimated to fall short of the baseline by approximately $6.1 billion. The following chart shows the forecast of lodging tax revenues from 2020 to 2025 as compared to the baseline projection of revenues.
Lodging Tax Revenue Forecast ($ millions)
.jpg)
Source: HVS
The effect of the COVID-19 pandemic on lodging tax revenue presents serious challenges to DMOs, convention centers, and other public and private agencies that are dependent on this revenue stream. The loss of revenues necessitates remedial actions on the part of federal, state, and local governments.
- Governments may need to refinance debt that is repaid by lodging tax revenues if reserves are insufficient to cover existing debt service obligations.
- Temporary closures of convention centers and reductions of DMO operations may require employee furloughs and other costs cutting measures.
- Cities need to seek replacement revenues to maintain venue operations and to provide ongoing support of their DMOs. The federal government is the only realistic source of replacement revenues because it is the only level of government that possesses the tools to generate the necessary fiscal stimulus. The revenues of state and local governments have been severely reduced and are likely to remain depressed during the recovery period.
- Convention center expansions and other public assembly venue projects may be delayed until alternative revenue sources can be found or lodging tax revenues fully recover.
However long the recovery takes, it is a temporary situation. Cities that emerge from this crisis with a plan of action will be best positioned to take advantage of future growth.
The projections contained in this report are based on information available at the time of this writing. Given rapidly changing circumstances, actual outcomes may be materially different from these forecasts. The HVS forecasts are aggegatted for the 25 urban markets included in the study and these projections should not be applied to any single market. Further and more detailed study would be necessary to project the perfomance of any individual market.
Our knowledge of the impact of the COVID-19 pandemic on the hospitality industry will continue to evolve as more information becomes available. HVS will monitor the impact on lodging tax revenues and update our analysis as appropriate.
Historical Lodging Tax Overview
Lodging taxes are typically ad valorem taxes (levied as a percentage of value) on short-term[7] overnight stays at hotels, motels, bed-and-breakfasts and other lodging accommodations. States authorize the imposition of lodging taxes, except in home rule cities.[8] States may tax lodging as a part of general sales and use tax, a specific lodging tax, or both. For most lodging taxes, state legislation defines the tax base, determines who is exempt from the lodging tax, and establishes collection procedures. States and municipal governments may distribute lodging tax revenues to their general funds, special revenue funds, or to local governments and special districts. Certain state and local governments also impose excise taxes on lodging, at a fixed amount per unit, such as a $1.00 per night fee for the furnishing of a hotel room.
In certain cities, state and municipal governments have formed special districts to levy additional lodging taxes on hotels located within a defined geographic subset of the city. Different districts within a city may have varying rates of lodging taxes. For example, Sacramento charges a higher special district rate of 3.00% for hotels in Downtown Sacramento and lowers the rate as hotels get further from the downtown area. Revenues from special district assessments frequently support the development of convention centers that generate room revenue for the hotel properties located in the district.
From a political perspective, lodging taxes may be easier to impose than other taxes because visitors that use lodging accommodations are not constituents of the local municipalities. Typically, hotel operators collect the tax from guests and receive a small administrative fee of one or two percent of collections.
While the legal incidence of the tax may fall on the consumer, the economic burden of the lodging tax is shared by both providers of lodging accommodations and their guests. The lodging market is competitive, and in a competitive market, the tax burden is shared between buyer and seller. A lodging tax raises the price of lodging accommodations. Depending on the elasticity of the supply and demand for lodging, the hotel manager may not be able to increase rates by the full amount of the tax. Since the elasticity of supply and demand changes depending on market conditions, the true incidence of a lodging tax varies as market conditions change. This study makes no attempt to estimate the economic incidence of lodging taxes.
Hotel owners are often willing to cooperate with local governments to impose lodging taxes dedicated to tourism promotion and convention center construction. For hotel owners, tourist-oriented public facilities and advertising serve as drivers of room demand. All of the hotels in a given market can benefit from programs that bring tourists and convention attendees to a city. Sponsoring these types of programs would be prohibitively expensive for any individual hotel. In the case of convention centers funded by a lodging tax, the hotels and individuals who benefit from the center pay for its construction and maintenance. Municipalities seek to benefit from visitor spending and the associated tax revenue that convention centers generate. Through the imposition of lodging taxes, those who benefit pay for advertising, marketing and sales efforts funded by lodging tax revenue.
Some states, particularly those with large tourism industries, prevent municipalities from depositing hotel tax revenue into their general funds. For example, Florida allows only a series of special purpose taxes for tourist development. Texas requires that local transient occupancy taxes fund convention center development or tourism promotion.
Since the 1970’s, lodging taxes have become commonplace across the country. Of the 150 largest U.S. cities examined in this study, more than 120 impose a dedicated tax, and all of them collect some form of taxation on hotel room revenue. In small suburban cities and major tourist destinations alike, lodging taxes have become an important source of funding for economic development initiatives. This study attempts to survey hotel tax implementation across the country to provide information for those who wish to compare the structure and revenue capacity of lodging taxes in a diverse set of markets.
Methodology
HVS’s nationwide study examined lodging taxes levied at the state and local level for the 150 most populous United States cities. HVS used data sources deemed to be reliable, including the following: comprehensive annual financial reports, annual adopted budgets, municipal codes, revenue reports, media sources, and interviews with government finance officials to determine the rate, collection, and distribution of lodging taxes at the state, county, city, and special district levels. In most cases, annual revenue figures were drawn from consistent sources year over year. All lodging tax rates, revenues, and distributions are reported in nominal dollars unless otherwise noted.
Local Rate Changes
State, county, and local governments passed into law a number of rate changes that took effect during or immediately following fiscal year 2019. Recent changes in lodging taxes in cities include the following:
Changes for Fiscal Year 2019
.jpg)
Source: Respective Jurisdictions
In addition to the state and local rate changes that took place during fiscal year 2019, HVS projects the following changes for fiscal year 2020:
Projected Changes for Fiscal Year 2020
.jpg)
Source: Respective Jurisdictions
State Tax Rates
All but two states impose a sales tax, a lodging tax, or both on overnight transient accommodations. Municipal governments impose lodging taxes in two states (Alaska and California) that do not tax hotel lodging. Twenty-five states impose lodging taxes that are not part of a broader sales or use tax. The table provided on the following page lists the sales tax, lodging tax, and total tax rate levied on lodging accommodations. It ranks the 50 states by the total tax rate applied to lodging.
States with high lodging tax rates typically have more restrictions on the imposition of local lodging taxes. To illustrate, Connecticut has the highest statewide lodging tax rate at 15% but forbids all local authorities from imposing additional lodging taxes. On the other hand, Oregon imposes a low state lodging rate but does not restrict local taxes.
.jpg)
Source: Respective Jurisdictions
Appendix A presents a detailed description of each state’s lodging taxes and annual revenue collections.
State Lodging and Sales Taxes Imposed on Hotels
.jpg)
Source: HVS and espective Jurisdictions
States Ranked by Total Ad Valorem Tax Rates on Lodging Accommodations 2019
.jpg)
Source: Respective Jurisdictions
State Lodging Tax Revenue
HVS analyzed annual state lodging tax revenues as stated in comprehensive annual financial reports, the majority of which report revenues on a modified accrual basis. In a few states where the final audited information was not available for fiscal year 2019, HVS recorded government estimates from budget reports. In some cases, government agencies provided annual lodging tax collection data instead of modified accrual data. Accrued revenues are recorded in the period in which the liability for tax payment occurs. Cash collections typically lag the period of liability by at least one month.
Depending on the size of their tax liabilities, taxpayers may remit payments monthly, quarterly, or annually.
Administrative charges, payment of back taxes, and penalties may also affect the level of reported revenues, but the amounts are not substantial. In some states, only sales tax revenues in the accommodations sector were available. Whereas lodging taxes are typically applied only to hotel room charges, sector-wide taxable sales might include other sources of taxable revenue such as food and beverage revenue. We did not attempt to estimate the percentage of taxable sales due solely to overnight stays.
.jpg)
Source: Respective Jurisdictions
.jpg)
Source: Respective Jurisdictions
Among the states that collect a lodging tax, revenue grew at an average rate of 3.77% from 2018 to 2019. This growth is higher than the average change from 2018 of 2.92% (and lower than the reate from 2017 of 4.6%) after adjusting for changes in inflation.
Oklahoma reported the largest change in revenue from fiscal year 2018 to 2019. The two states with state lodging/sales tax changes in fiscal year 2019—Louisiana and Utah—were not included in the list of states with the highest/lowest lodging tax revenue growth.
The following table presents a six-year history of lodging tax revenue for each of the twenty-five states that have imposed a dedicated lodging tax. Revenue reported from past years has been adjusted for inflation. Data is presented in millions of dollars, and the states are ranked by 2019 revenues.
Rank of States by 2019 Lodging Tax Revenues (millions)
.jpg)
Source: Respective Jurisdictions
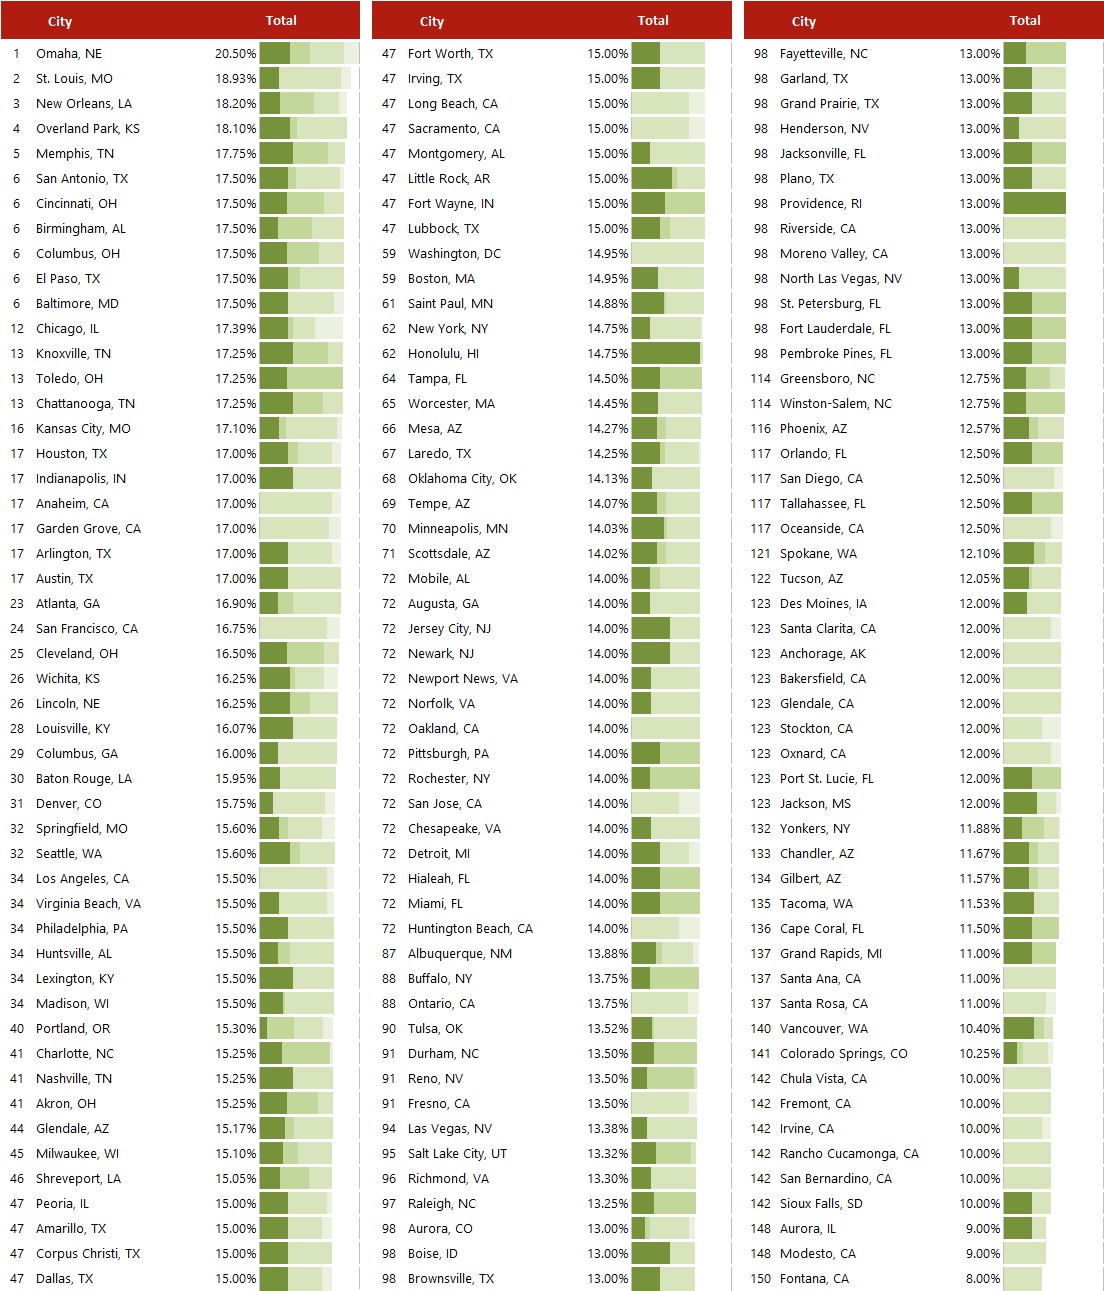
Total Lodging Tax Rates
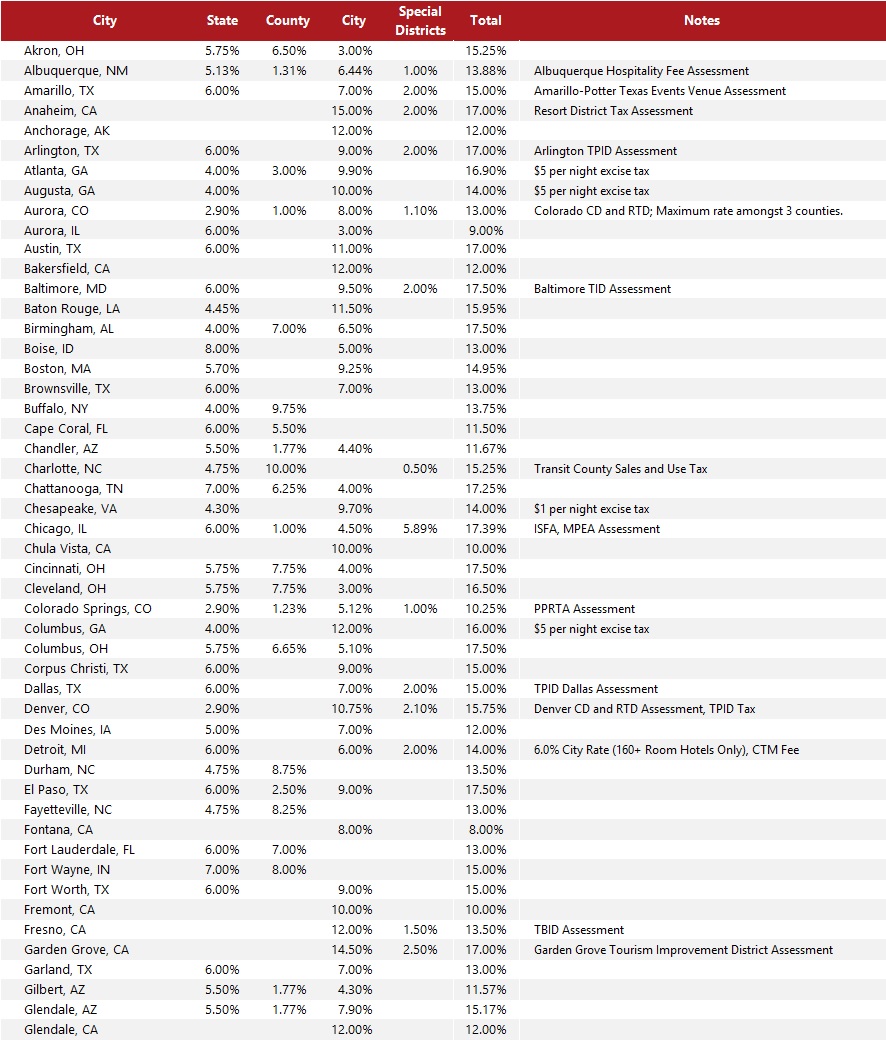
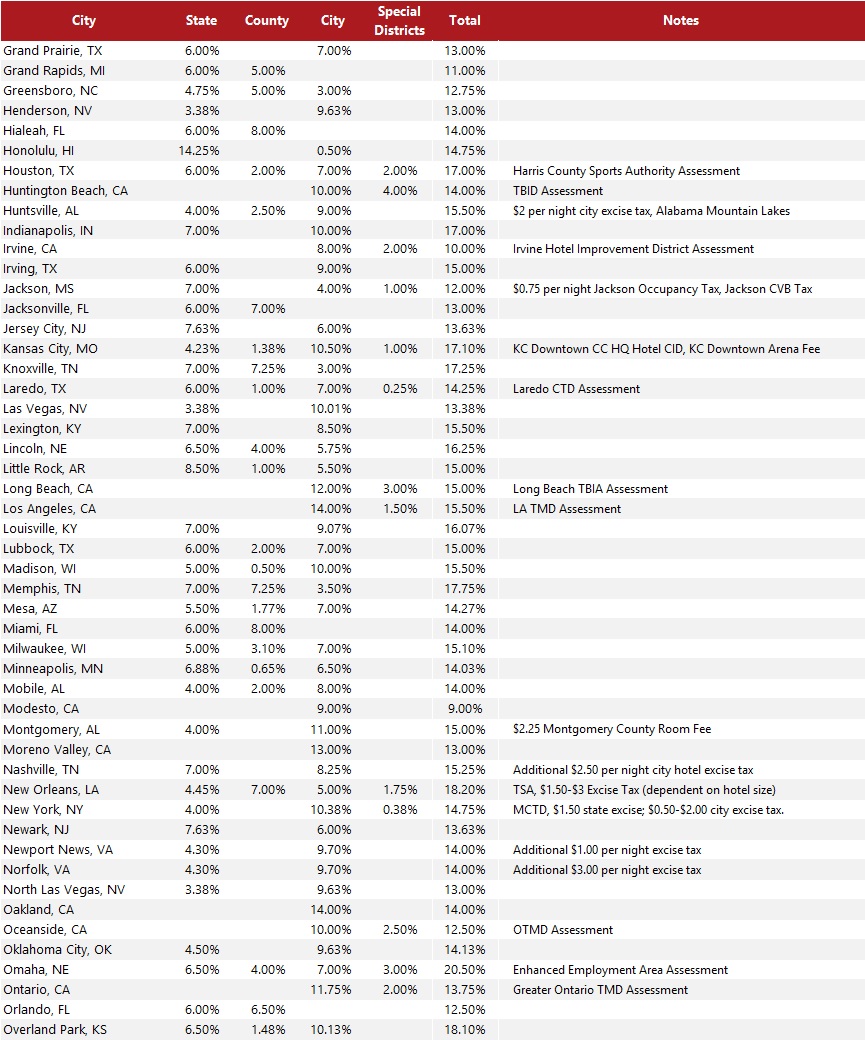
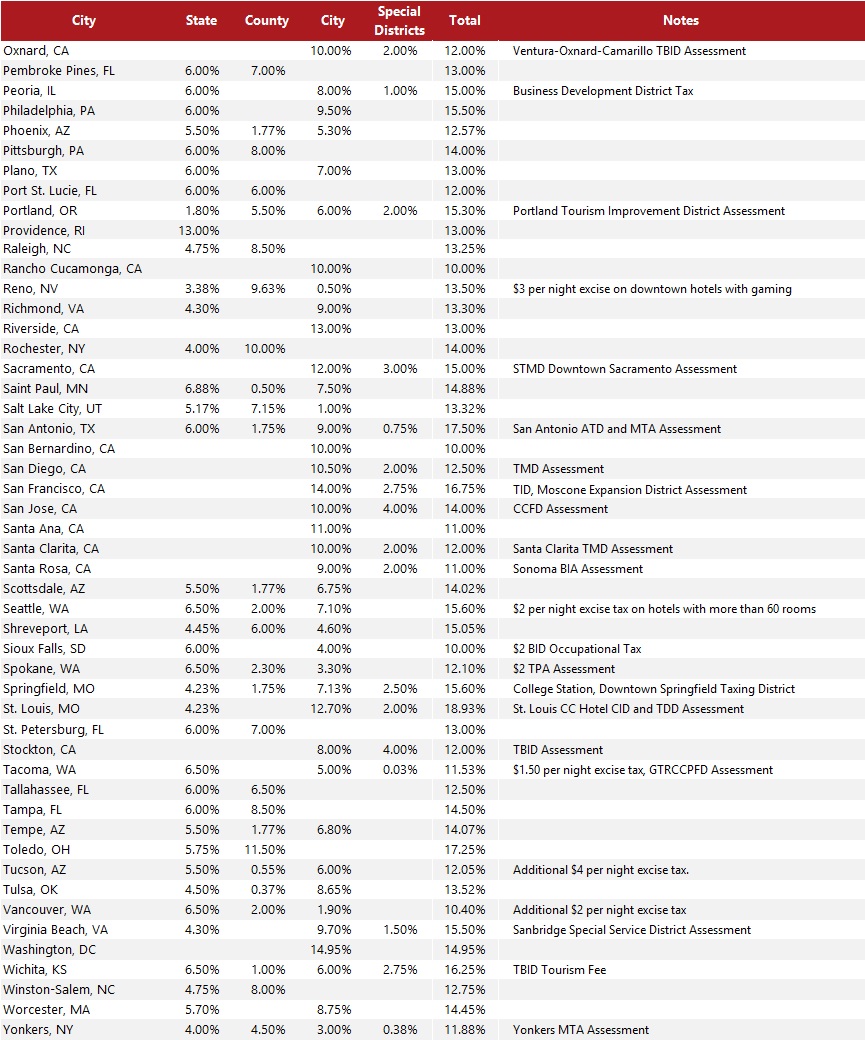
HVS researched the total tax rate applied to lodging accommodations in the 150 most populous United States cities as projected from the 2010 census. The total tax rate is comprised of all state, county, city, and special district taxes levied on lodging facilities within the urban center of the city where the highest special district taxes may be applied. The following tables list the tax rate applied to overnight stays at lodging facilities at the state, county, city, and special district levels, as well as the total rate imposed on an overnight stay at a lodging facility in the urban center of each of the 150 largest cities in the United States.
.jpg)
Source: Respective Jurisdictions
To calculate the special district rate, HVS calculated the tax rate an overnight visitor would pay to stay at the hotel with the highest tax rate within a special taxing district. Due to special taxing districts, the tax rate at a particular hotel can be influenced by its location, size, or other factors that determine tax rates.
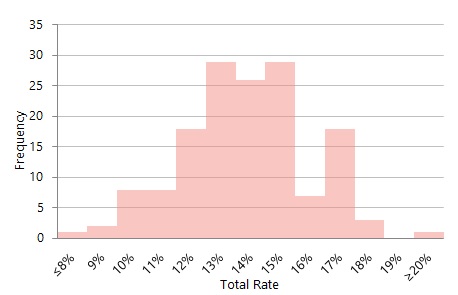
The figure below shows a distribution of combined lodging tax rates in the 150 largest U.S. cities.
Frequency of Total Lodging Tax Rates
Source: HVS and Respective Jurisdictions
The table on the following page ranks 150 cities by total lodging tax rate. This enables a comparison of the cities and provides a breakdown of tax rates by unit of government.
Top 150 Urban Centers Total Lodging Tax Rate Ranking 2019
![]()
Source: Respective Jurisdictions
Tax Rates in Top 150 Urban Centers 2019
Source: Respective Jurisdictions
Tax Rates in Top 150 Urban Centers 2019 - Continued
Source: Respective Jurisdictions
Tax Rates in Top 150 Urban Centers 2019 - Continued
 Source: Respective Jurisdictions
City Lodging Tax Revenue
The following tables describe the lodging tax revenue that the 150 most populous cities collected from lodging taxes. Unless otherwise noted, the tax rate and revenue listed only pertains to the citywide lodging tax and does not include special district taxes or city sales taxes. Consequently, the revenue figures presented for comparable cities can diverge greatly. For example, a city in California with an average lodging tax rate will show greater revenue year over year than a similar city in Nevada, where taxes are levied primarily at the state and special district level. For individual cities, revenues are reported from consistent sources each year.
Source: Respective Jurisdictions
Source: Respective Jurisdictions
In some states and cities, lodging taxes are imposed by the county rather than city level. For example, cities in Florida, Indiana, and parts of New York do not levy municipal lodging taxes. In such cases, we list county lodging tax revenues. Year-over-year revenue changes may reflect tax rate changes and underlying changes in taxable receipts for lodging.
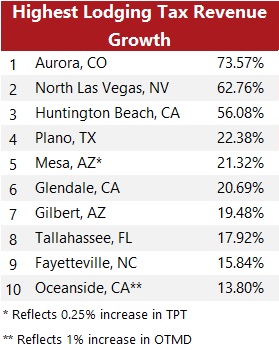
Aurora, CO reported a 73.57% increase in lodging tax revenue, largely attributable to the opening of the Gaylord Convention Center. Of the top ten cities with the highest lodging tax revenue, only Mesa, AZ and Oceanside, CA saw an increase in their lodging tax rate In HVS’ 2019 Lodging Tax Report, North Las Vegas, NV was the city with the lowest lodging tax revenue growth.
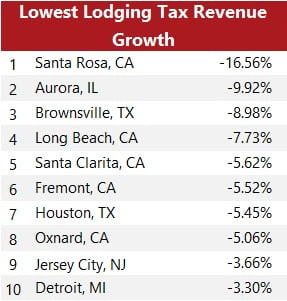
When compared to the cities experiencing the highest lodging tax revenue growth, those cities experiencing the lowest growth are largely located away from traditional tourist destinations. California and Texas cities account for seven out of the ten cities with the lowest lodging tax revenue growth. Additional factors such as weather events, seasonality , or budgeted declines in revenue can cause lodging tax revenue to decline from year to year.
Reported Lodging Tax Revenues in Top 150 Urban Centers ($ Millions)
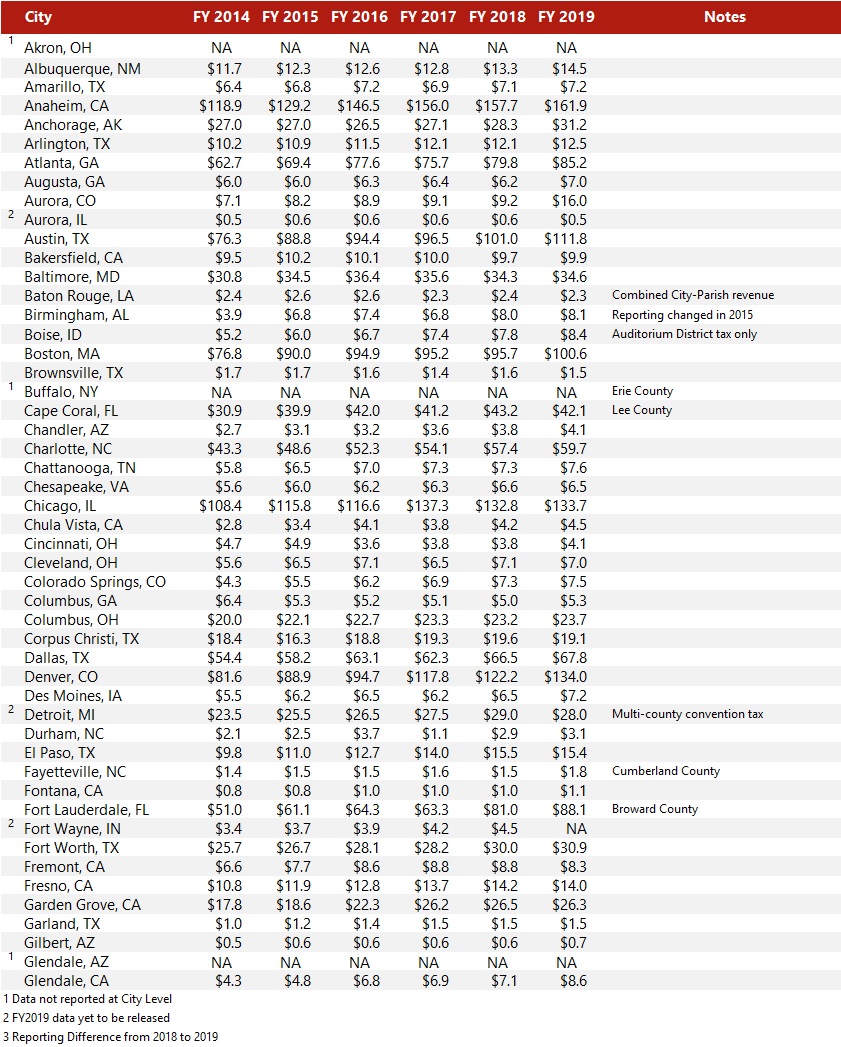
Source: Respective Jurisdictions
Reported Lodging Tax Revenues in Top 150 Urban Centers ($ Millions) - Continued
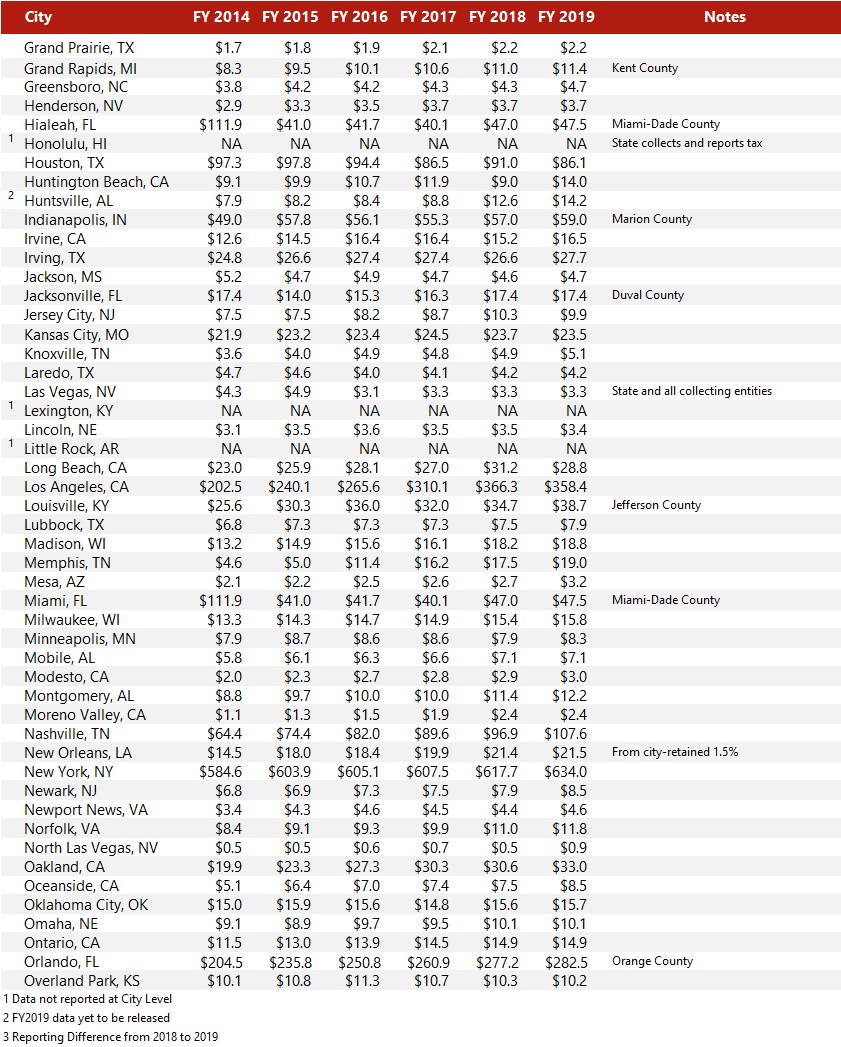
Source: Respective Jurisdictions
Reported Lodging Tax Revenues in Top 150 Urban Centers ($ Millions) - Continued
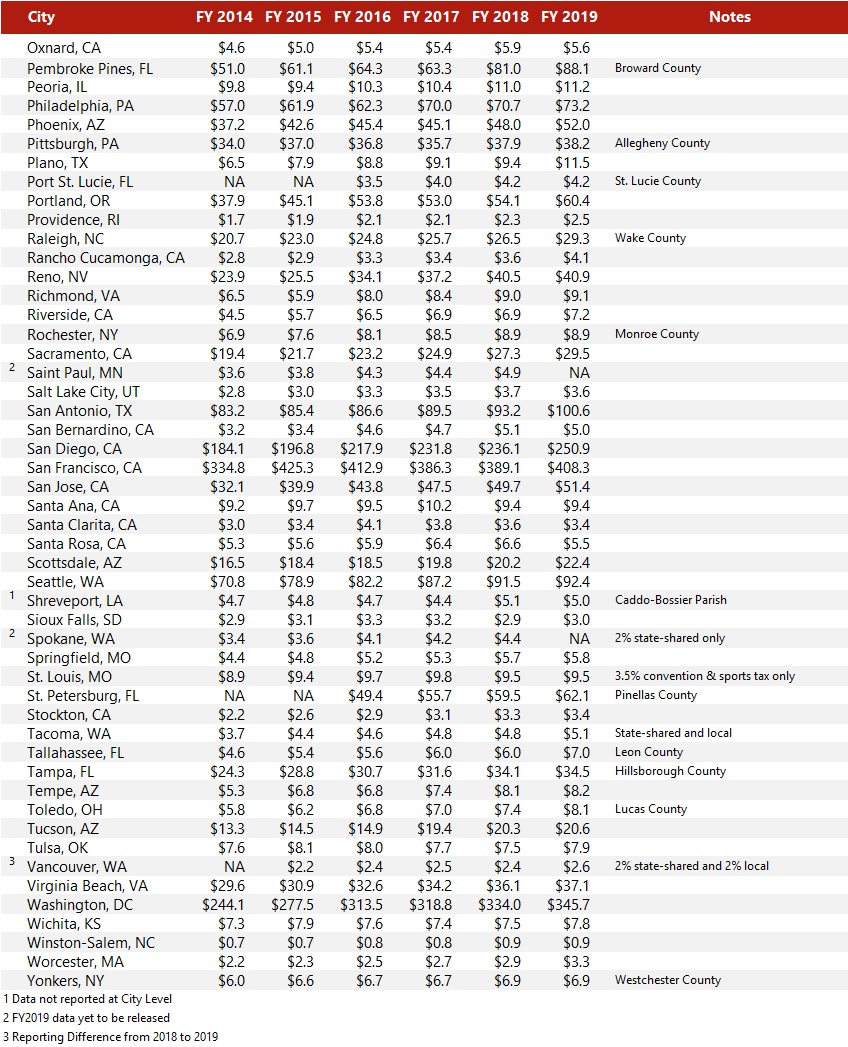
Source: Respective Jurisdictions
Excise Taxes
In addition to percentage taxes on gross room revenues, some hotel are also subject to excise taxes on lodging transactions. States, cities, or special districts may charge a flat fee per room night on all hotel rooms within their boundaries. Excise taxes tend to be less volatile because their amount only depends on the occupancy and is not subject to room price variations. However, excise taxes do not grow with inflation or room rate increases.
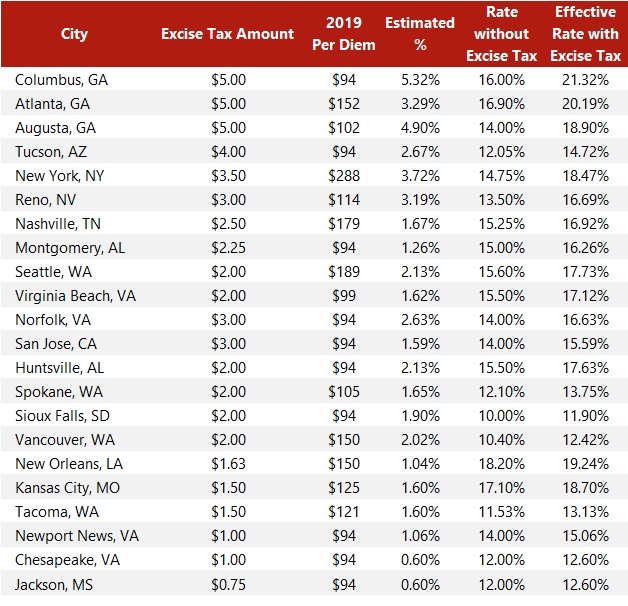
Hotels in 22 cities are subject to a state, city-wide or special district excise tax. Excise taxes range from $0.75 to $5.00 per room night, with an average of $2.61 . HVS calculated each city’s excise tax as a percent of its per diem rate (in fiscal year 2019 dollars) to provide an example of effective rates. A city’s “effective rate” indicates the average rate a person pays if the excise tax were included as a percent of total sale price. For this example, HVS used the per diem rates set by the U.S. General Services Administration (GSA). The per diem rates set by the GSA are usually lower than the average daily rates at hotels in the specified areasThe chart below is for illustrative purposes only.
On average, every dollar charged in excise tax is roughly equivalent to an ad valorem tax increase of 0.86% for 2019.
Selected Effective Rates of Excise Taxes
Source: HVS, GSA, and Respective Jurisdictions
Room Revenue Trends
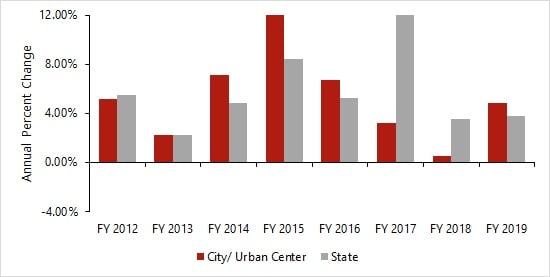
Since reporting and payment of lodging taxes are mandatory, data on tax revenue provides a useful way to assess the performance of the lodging industry. HVS estimated the amounts of taxable room revenue in each state and city by dividing the tax revenues by the tax rate. Taxable room revenues are typically less than gross room revenues because most lodging tax laws provide some exemptions such as room rental paid by military personnel or government employees. The figure below shows estimated taxable room revenues for the states and cities for which data is available.
Estimated Average Annual Change in Taxable Room Revenue in State and Cities (2019 $Millions)[9]
Source: HVS and Respective Jurisdictions
Airbnb Lodging Tax Collections
Short-term home rental services such as Airbnb, HomeAway, and VRBO have grown popular among travelers, with Airbnb being the dominant player in the market. Often called parts of a sharing economy, these peer-to-peer platforms allow homeowners to rent out a spare room or an entire house or apartment to travelers seeking “unique travel experiences” and accommodations. Airbnb has exponentially grown since its founding. In September of 2020, Airbnb reported over seven million worldwide listings across 100,000 cities on its website.
Airbnb does not make rental data publicly available. However, STR published a research brief, “Airbnb & Hotel Performance,” in 2016, which compared room rates, occupancy levels, room demand, and Airbnb’s impact on hotel compression nights by year.
In reaction to Airbnb’s growth, cities have been forced to confront challenges related to the impact of rapid growth in short-term rentals. Hoteliers have raised issues of fairness since since short-term rentals are typically subject to a comparable level of regulation, permitting, and taxation. Residents have raised concerns over the neighborhood impacts of transient visitation. In response, many cities and states have imposed new-taxes and regulations on short-term rentals.
To gain legitimacy and permanence within the United States, Airbnb has been urging local governments to allow it to collect and remit lodging taxes on the hosts’ behalf. In the past two years, states and cities have made considerable efforts to collect taxes from Airbnb.
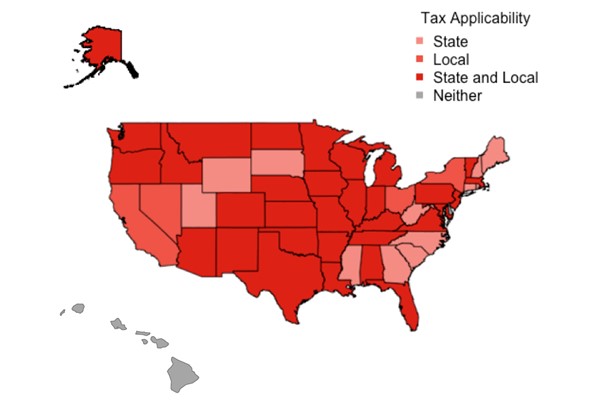
The map below shows the states in which Airbnb applies only local lodging taxes or a combination of state and local lodging taxes.
Airbnb Lodging Tax Collection by State
Source: HVS and Airbnb
Disclaimer
HVS’s lodging tax study recognizes that lodging tax rates, collections, and distributions are in constant flux. The data presented herein is HVS’s best attempt to gather the most recently available information. HVS used sources deemed to be reliable and assumes that this information is accurate. All questions, comments, or concerns are welcome in the continuing process to accurately present the current and historical trends of lodging taxes in the United States.
[1]“Gross Domestic Product, 2nd Quarter 2020 (Second Estimate); Corporate Profits, 2nd Quarter 2020 (Preliminary Estimate),” Bureau of Economic Analysis, August 27, 2020. (www.bea.com)
[2]Phill Swagel, “CBO’s Current Projections of Output, Employment, and Interest Rates and a Preliminary Look at Federal Deficits for 2020 and 2021,” Congressional Budget Office, April 24, 2020. (thewebsiteifapplicable.com)
[3]“The Impact of COVID-19 on the United States Travel Economy,” Oxford Economics, April 15, 2020. (www.ustravel.org)
[4]“COVID-19 Travel Industry Research,” U.S. Travel Association, September 10, 2020. (www.ustravel.org)
[5]“COVID-19 Travel Industry Research,” U.S. Travel Association, September 10, 2020. (www.ustravel.org)
[6]Jared Walczak, “Designing a State and Local Government Relief Package,” Tax Foundation, May 12, 2020. (www.taxfoundation.org)
[7]Typically defined in ordinances as being fewer than thirty days.
[8]Home rule cities are cities that have their own taxing authority, have adopted home rule charter for their self-governance, and are not limited to exercising only those powers that the state expressly grants to them.
[9]HVS estimated revenues for each year by computing the revenue change in each city or state for which data was available, then averaging the revenue changes of all cities or states.