The SARS Outbreak of 2003
Severe Acute Respiratory Syndrome (SARS) was first reported in Asia in February 2003. Based on further research, the earliest case dates to November 2002, while the last cases were reported in June 2003. During that period, a total of 8,098 cases were reported; of those cases, 7,324 people recovered, and 774 people died. Although the virus appeared in 37 countries, the majority of the cases were in Asia. The only country outside of Asia to report a significant volume of cases was Canada, and most of these were in the greater Toronto area.Location and Number of SARS Cases and Deaths
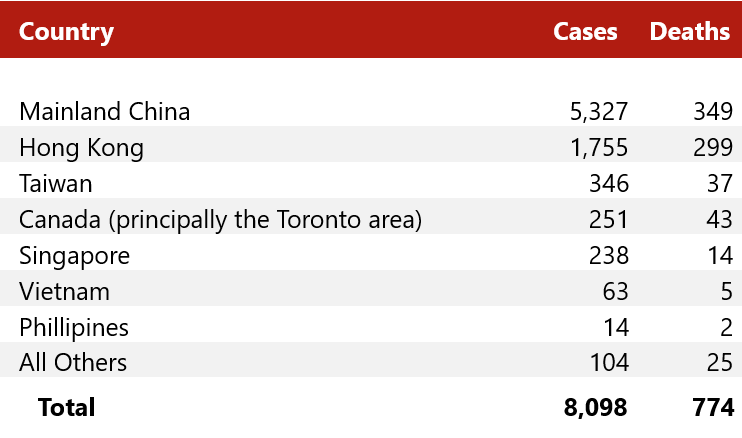 Source: World Health Organization
As it has in the present situation, the WHO issued regular bulletins as information concerning the disease and identified cases became available. The first of these was issued on March 15 and was followed by regular updates. The bulletins generally addressed the number of cases and deaths, reported the areas affected, and discussed the progress in identifying and treating the disease and its symptoms. The WHO bulletins also addressed the issue of travel and, as it deemed appropriate based on the number of cases and the pace of new cases reported, issued travel advisories pertaining to specific regions. Notably, at no time did the WHO issue a travel restriction; the strongest advisory recommended that people “postpone all but essential travel” to specified destinations. The destinations initially specified were Hong Kong and Guangdong Province, China. Toronto, Beijing, Shang-XI Province, Taiwan, and Inner Mongolia were subsequently added to the list.
Toronto was the only region outside of Asia that was identified as an “affected area” for which the WHO issued a travel advisory. SARS was first reported in Canada in mid-March 2003; as of March 15, the WHO reported seven cases and two deaths. The chronology of SARS in Toronto is summarized in the following table.
Toronto was the only region outside of Asia that was identified as an “affected area” for which the WHO issued a travel advisory. SARS was first reported in Canada in mid-March 2003; as of March 15, the WHO reported seven cases and two deaths. The chronology of SARS in Toronto is summarized in the following table.
Chronology of SARS in Canada
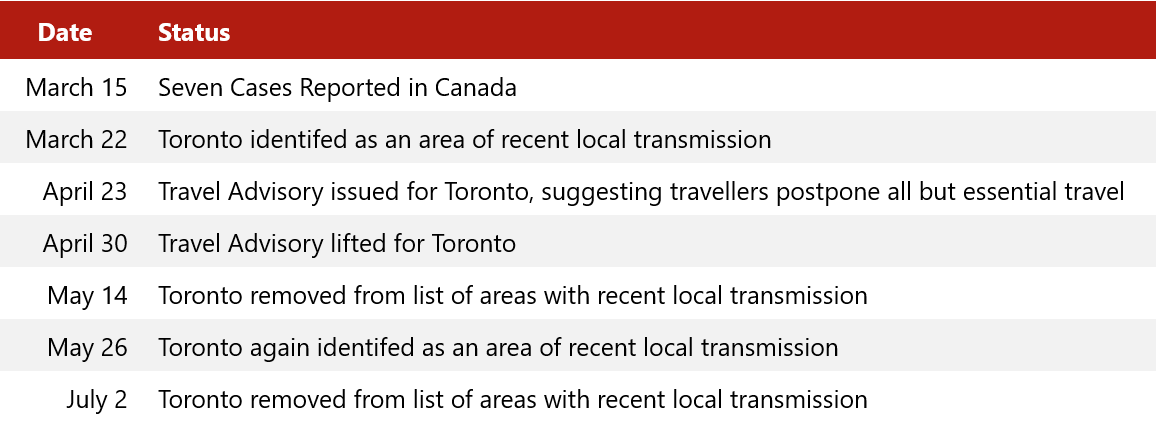 Source: World Health Organization
The WHO identified Toronto as an “area with recent, local transmission;” this designation indicates that the cases are spreading internally within the region, rather than being brought in by travellers from outside the area. This designation was in place from March 22 through May 14, and reinstated for a second period, from May 26 to July 2, 2003. The recurrence of the “area of recent local transmission” designation is significant, in that it was the result of an outbreak that occurred at a point in time when SARS was believed to be under control in that area.
The travel advisory was in place for only one week, at the end of April. Yet even prior to the advisory, and well after it was lifted, the travel industry in Canada felt significant, adverse effects as a result of the media reports of the identification of SARS cases in the country.
The travel advisory was in place for only one week, at the end of April. Yet even prior to the advisory, and well after it was lifted, the travel industry in Canada felt significant, adverse effects as a result of the media reports of the identification of SARS cases in the country.
Impact of SARS on the Canadian Travel Industry
To assess the impact of SARS on the Canadian lodging industry, we have reviewed trends in lodging demand in both Canada and the U. S. The following chart presents the percent change in total lodging demand in each country in the years preceding and immediately following the SARS outbreak in 2003.
Change in Lodging Demand in the U.S. and Canada – 1992 through 2008
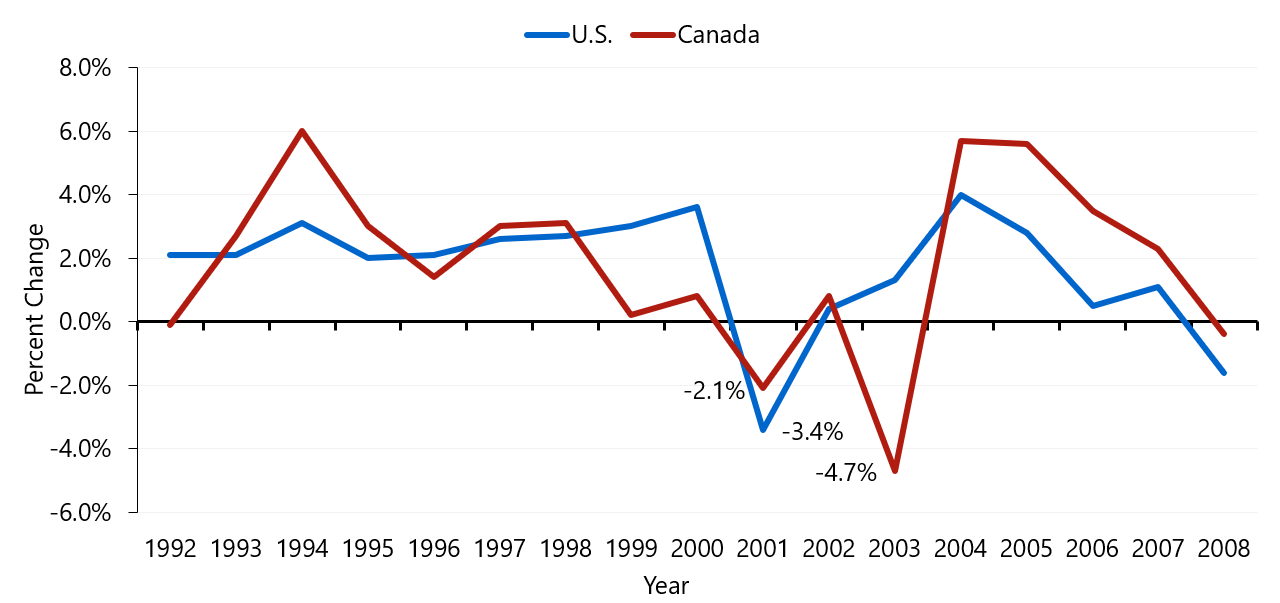 Source: STR
Historically, there has been a correlation between lodging demand in Canada and the U.S., which is logical given the close economic and geographic ties between the two countries. As the chart indicates, while the magnitude of the change differs, the direction and longevity of the trends are aligned. The absence of this correlation in 2003 reflects the impact of SARS on the Canadian lodging market. Following the sharp downturn recorded in 2001, U.S. lodging demand recorded steady increases as the market recovered from the recession and adverse impacts and aftermath of the September 11 attacks. The Canadian lodging market also experienced a downturn, albeit less substantial, in 2001. Data for 2002 indicate that a recovery in this market was underway, as well. However, in 2003, the SARS outbreak and related travel scare interrupted the market’s progress. As a result of this scare, demand in Canada decreased by 4.7% in 2003; this is more than double the decrease recorded in 2001, and 40% higher than the decrease experienced by the U.S. in 2001.
Impact of SARS on the Toronto Lodging Market
Although SARS cases were reported in several regions in Canada, the vast majority were concentrated in the Toronto area. To gauge the magnitude of the impact of SARS on the Toronto lodging market, we have reviewed STR data for 17 hotels that comprised the principal lodging market in Downtown Toronto at that time. The following chart presents the percent change in demand levels for this set of hotels over the period from January 1, 2001, through December 31, 2003.
Percent Change in Lodging Demand in Toronto – 2001 through 2003
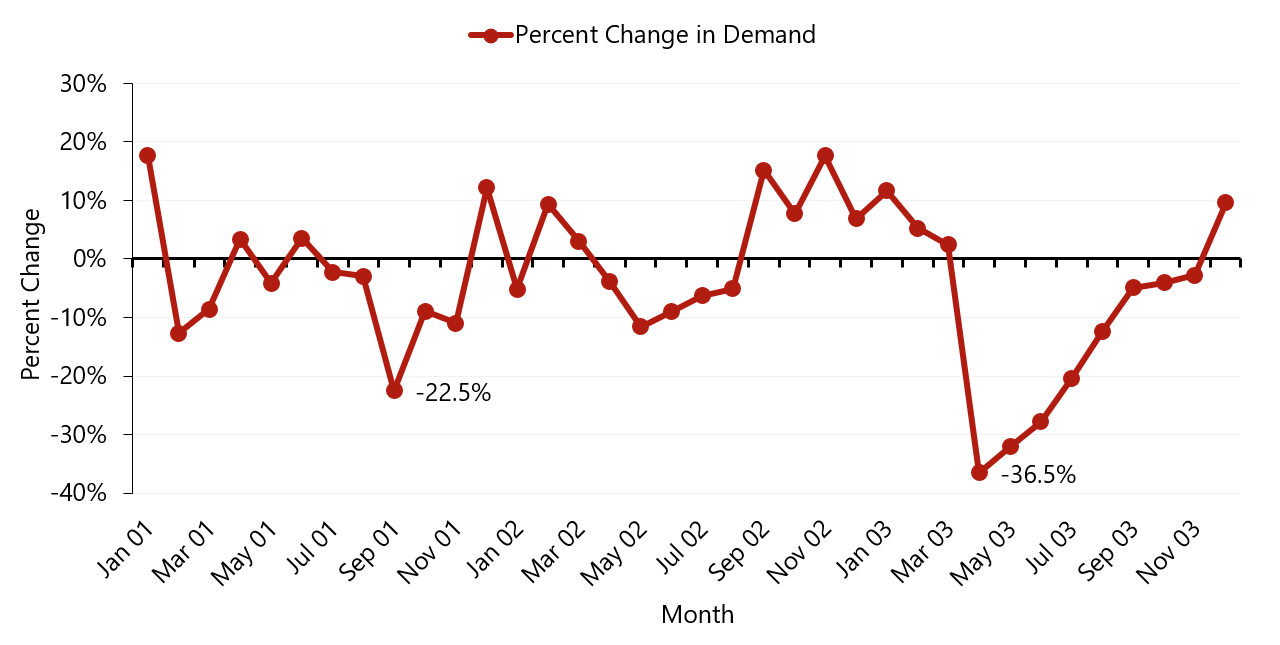 Source: STR
As the above chart clearly demonstrates, SARS had a far more dramatic impact on the Toronto lodging market than did the events of September 11, 2001. Demand dropped by 36.5% in April 2003, compared to April 2002, the first full month when the SARS situation was known. Although April showed the most significant decline, the market continued to experience demand decreases in excess of 20% through July of that year and continued to report demand levels lower than the same month of the prior year through November. As previously noted, the city was removed from the list of “areas with recent local transmission” on July 2, 2003. While the decreases in demand moderated somewhat thereafter, the extended span of the downturn is striking. In all, over the period April through November 2003, the market reported over 257,000 fewer accommodated room nights than in the same period of 2002. This equates to over CA$83 million in revenues. Over the full year 2003, demand was off by just under 220,000 room nights, and revenues were off by CA$80 million (rounded).
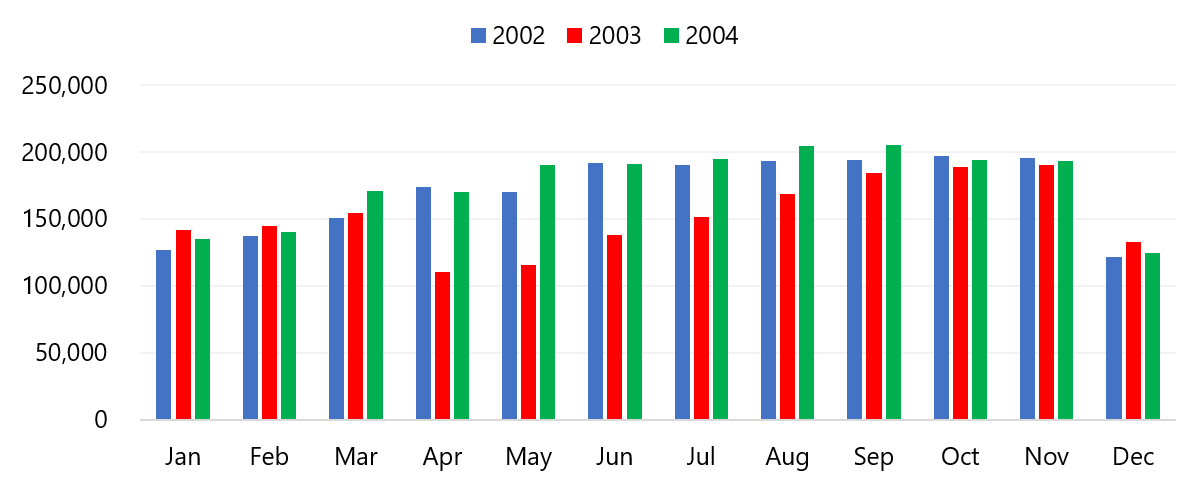
On the demand side, the market was able to recover the lost ground within a year. As the following chart shows, the number of accommodated room nights in 2004 was on par with, or exceeded, the demand levels recorded in 2002, prior to the SARS outbreak.
Occupied Room Nights by Month – 2002 through 2004
 Source: STR
The total occupied room nights in 2004 exceeded the number of room nights occupied in 2002, indicating that the market was able to recover the ground lost during the SARS scare relatively readily. However, it is not clear that the market was able to reach the levels that it could have been expected to attain by 2004, had the momentum of growth evident in the 2002 statistics been sustained. On the revenue side, the data for this set of hotels indicate that the market did not regain the revenue levels recorded in 2002 until 2006, as the lingering effects of the price discounts implemented in response to the SARS scare undermined the recovery of average rate (ADR) until that year. A review of the 2003 monthly data indicates that the aggregate ADR for this set of hotels dropped by over $20.00 in April. The decline increased to over $40.00 in May, June, and July; this represents a 25% decrease over the ADR reported in the previous year. Rates continued to be down, although not as significantly, through the balance of the year. Annually, the ADR in 2003 was 14%, or almost $24.00, lower than that achieved in 2002.
Lessons Learned from the SARS Pandemic
The good news is that the data indicate that demand lost due to a discrete phenomenon (such as a flu scare) can be recovered relatively readily, although not as quickly as it can be lost. More problematic is the question of momentum, and the impact of such an event on overall trends in the market. The Toronto market surpassed 2002 demand levels in 2004; however, had the market been able to maintain the pace achieved by comparable markets in the U.S., it would have surpassed 2002 levels in 2003 and could have achieved further growth in subsequent years.
The ADR issue is more compelling. The aggregate ADR for the Toronto hotels did not recover to 2002 levels until 2006, in large part due to the draconian discounts implemented by hotels in the city in an immediate response to the sharp drop in demand. In retrospect, given the reasons for the precipitous decrease in travel, it seems extremely unlikely that lower rates would induce any demand into the market. How high would the perceived value of a hotel stay have to be to overcome the fear of becoming infected with a potentially life-threatening disease? While discounting might be an effective tool once the perceived threat has passed, it is not likely to have affected demand levels during the period when fear was the dominant factor influencing travel.
The ADR issue is more compelling. The aggregate ADR for the Toronto hotels did not recover to 2002 levels until 2006, in large part due to the draconian discounts implemented by hotels in the city in an immediate response to the sharp drop in demand. In retrospect, given the reasons for the precipitous decrease in travel, it seems extremely unlikely that lower rates would induce any demand into the market. How high would the perceived value of a hotel stay have to be to overcome the fear of becoming infected with a potentially life-threatening disease? While discounting might be an effective tool once the perceived threat has passed, it is not likely to have affected demand levels during the period when fear was the dominant factor influencing travel.
Other Examples
SARS is the most comparable to the current coronavirus pandemic, but not the only such event. The 2009 H1N1 “Swine Flu” epidemic had a significant negative impact on Mexico, which was the point of origin and the country with the most reported cases. Travel to Mexico City and the country’s multiple resort destinations dropped significantly that year, although it is difficult to isolate the impact of the H1N1 virus from the concurrent global economic downturn.
More recently, the Zika virus scare affected travel in 2016 and 2017. The highest incidence of cases was in Brazil; within the U.S., Florida reported the most cases. Concerns about exposure reportedly led to a downturn in travel to the state, and specifically Miami Beach and the surrounding markets, as the Centers for Disease Control and Prevention (CDC) issued a travel advisory recommending that pregnant women not travel to a 4.5-square-mile area of Miami Beach. The advisory was in effect from mid-July through mid-November. As with the H1N1 scare, other factors in the market make it difficult to identify the specific impact of Zika on the travel and lodging industries during that period, including an influx of new supply, the closure of the Miami Beach Convention Center for renovation, and a variety of seasonal influences. However, media reports at the time indicated that hotel bookings were significantly down in August and noted that airfares targeted toward the leisure segment dropped in this period, as well.
More recently, the Zika virus scare affected travel in 2016 and 2017. The highest incidence of cases was in Brazil; within the U.S., Florida reported the most cases. Concerns about exposure reportedly led to a downturn in travel to the state, and specifically Miami Beach and the surrounding markets, as the Centers for Disease Control and Prevention (CDC) issued a travel advisory recommending that pregnant women not travel to a 4.5-square-mile area of Miami Beach. The advisory was in effect from mid-July through mid-November. As with the H1N1 scare, other factors in the market make it difficult to identify the specific impact of Zika on the travel and lodging industries during that period, including an influx of new supply, the closure of the Miami Beach Convention Center for renovation, and a variety of seasonal influences. However, media reports at the time indicated that hotel bookings were significantly down in August and noted that airfares targeted toward the leisure segment dropped in this period, as well.
Broader Impacts – International Travel
As discussed, there are strong parallels between SARS and the coronavirus; both originated in China, and the diseases are similar in terms of symptoms, severity, and transmission. However, in terms of international travel and tourism, the context in which the coronavirus is occurring is radically different from when SARS occurred in 2003.
Over the intervening years, China has emerged as a global force in tour and travel. According to the Ministry of Culture and Tourism of the People's Republic of China, in 2018, a total of roughly 150 million international travellers originated from China, up 15% from 2017 levels. In 2017, this source reported the total spending by all outbound Chinese tourists was valued at US$115 billion. Countries in Southeast Asia are the most popular, accounting for eight of the top ten destinations; in many of these countries, China is the top source of international tourism. The other two countries on the top ten list are the U.S. and Russia.
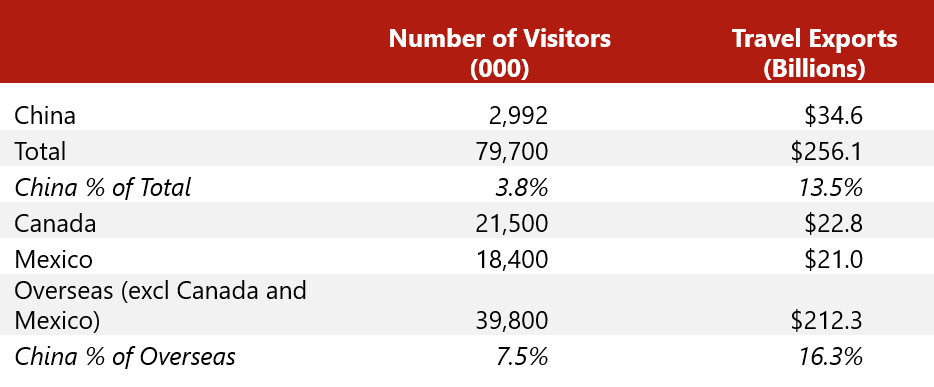
The U.S. has benefited from the surge in outbound Chinese travel. The National Travel and Tourism Office of the U.S. Department of Commerce reported that the roughly three million visitors from China accounted for 3.8% of total international visitors and 7.5% of overseas visitors (excluding Canada and Mexico) in 2018. The economic impact of these visitors comprised a disproportionate share of total travel exports (visitor spending in the U.S.); China’s $34.6 billion is 13.5% of total travel exports and 16.3% of overseas travel exports.
Over the intervening years, China has emerged as a global force in tour and travel. According to the Ministry of Culture and Tourism of the People's Republic of China, in 2018, a total of roughly 150 million international travellers originated from China, up 15% from 2017 levels. In 2017, this source reported the total spending by all outbound Chinese tourists was valued at US$115 billion. Countries in Southeast Asia are the most popular, accounting for eight of the top ten destinations; in many of these countries, China is the top source of international tourism. The other two countries on the top ten list are the U.S. and Russia.
The U.S. has benefited from the surge in outbound Chinese travel. The National Travel and Tourism Office of the U.S. Department of Commerce reported that the roughly three million visitors from China accounted for 3.8% of total international visitors and 7.5% of overseas visitors (excluding Canada and Mexico) in 2018. The economic impact of these visitors comprised a disproportionate share of total travel exports (visitor spending in the U.S.); China’s $34.6 billion is 13.5% of total travel exports and 16.3% of overseas travel exports.
International Travel to the U.S. by Country of Origin - 2018
 Source: U.S. Department of Commerce, National Travel and Tourism Office
The data for 2018 reflect a 5.7% decrease in the number of visitors and a 2.2% decline in travel exports from 2017 levels. Statistics for the year-to-date through October 2019 period indicate a similar decline. The recent drops in Chinese tourism have been widely attributed to the trade wars with China. Nevertheless, the current level of visitation is over ten times greater than the number of visitors from China in the early 2000s, as is illustrated by the following graph.
Total Arrivals to U.S. From China
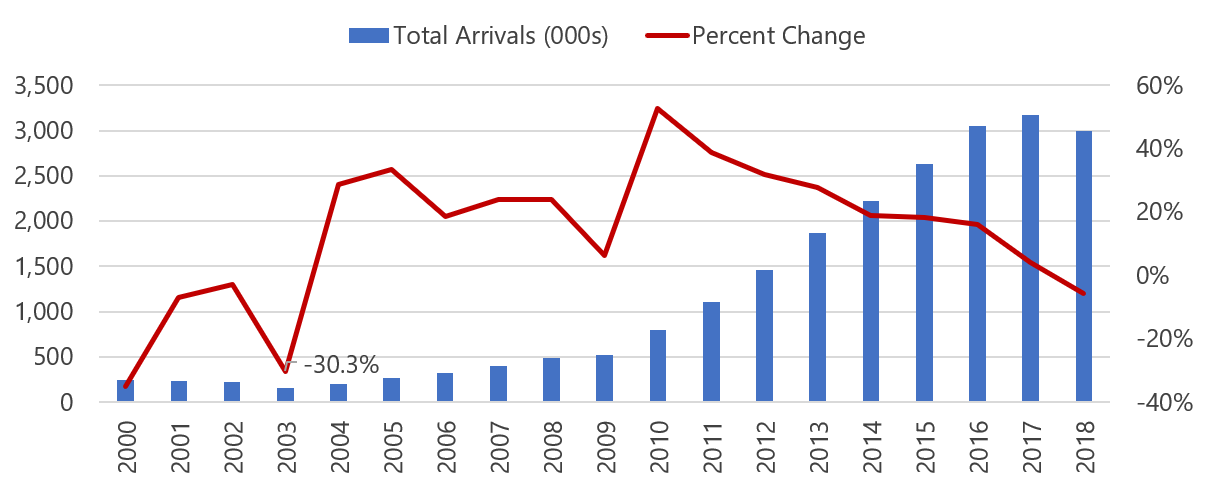
In terms of spending, the 2018 total of $34.6 billion is almost 15 times the $2.3 billion total spending by Chinese visitors to the U.S. recorded in 2002.
Impact of SARS on Inbound Travel to the U.S. from China
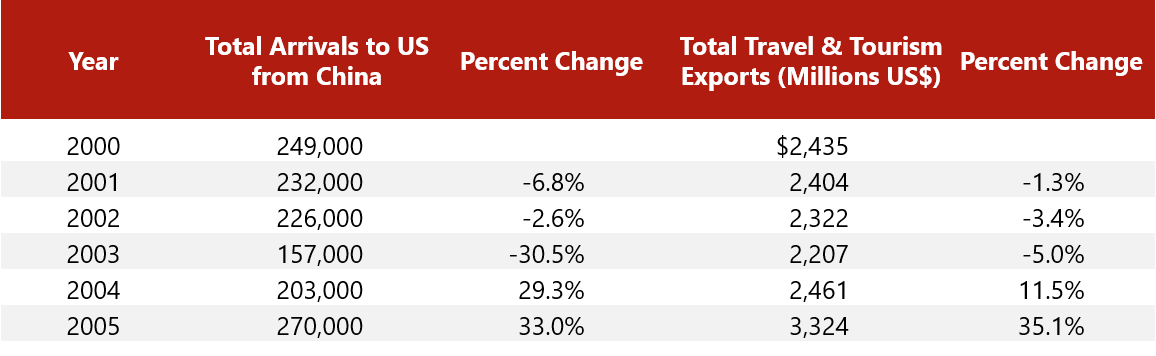
The following table presents the number of Chinese travellers and total travel and tourism exports over the period from 2000 through 2005, illustrating the impact of the 2003 SARS pandemic on travel.
Chinese Tourism and Spending 2000 - 2005
 Source: U.S. Department of Commerce, National Travel and Tourism
Concurrent with the SARS pandemic, the number of arrivals to the U.S. from China dropped by over 30%, or 69,000. By 2005, the volume of arrivals had surpassed the earlier peak, and the value of travel and tourism exports to China had increased by $1 billion over pre-SARS levels.
Impact of Zika Virus on Inbound Travel to the U.S. from Brazil
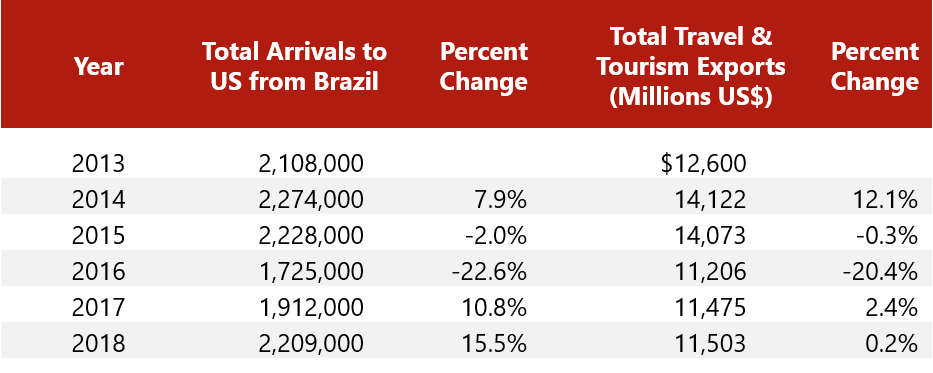
The following table illustrates the impact of the Zika virus on the number of Brazilian travelers and total travel and tourism exports over the period from 2013 through 2018, illustrating the impact of the Zika virus pandemic on travel.
Brazilian Tourism and Spending 2000-2005
Source: U.S. Department of Commerce, National Travel and Tourism Office
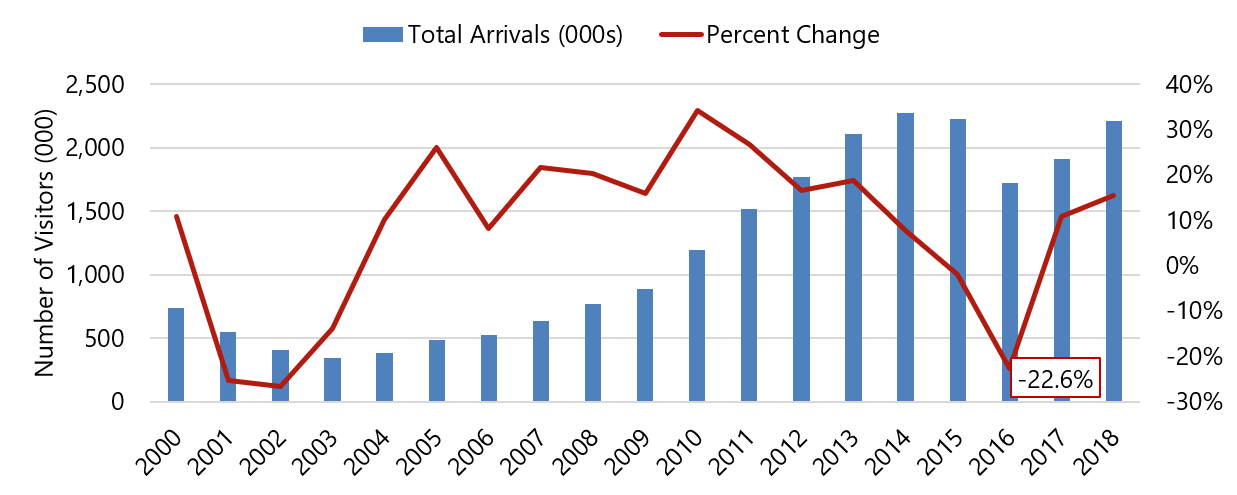
Looking at the Zika virus pandemic, in 2016, the year of the outbreak, the number of arrivals to the U.S. from Brazil dropped by 22.6%. This is less dramatic than the 30.3% decline during SARS. Moreover, the Zika virus outbreak coincided with a downturn in the Brazilian economy, as evidenced by the Brazilian GDP, which fell by 3.6% and 3.4% in 2015 and 2016, respectively. The economic challenges no doubt contributed to a decline in travel, and the limited recovery in total spending can also be at least partially attributed to this factor, as well.
Total Arrivals to U.S. from Brazil
Impact of Coronavirus on Travel
The full impact of the coronavirus on international travel will depend on the extent of the pandemic and the duration of related travel restrictions. The response of the public, the “fear factor,” will also influence the total impact, particularly with respect to the periods after the travel restrictions are lifted. Clearly, however, there is much more at stake than was the case in 2003. If the SARS impact were to be repeated, a 30% decrease in the number of visitors equates to 900,000 fewer travellers, and a 5% decrease in spending equates to $1.7 billion.
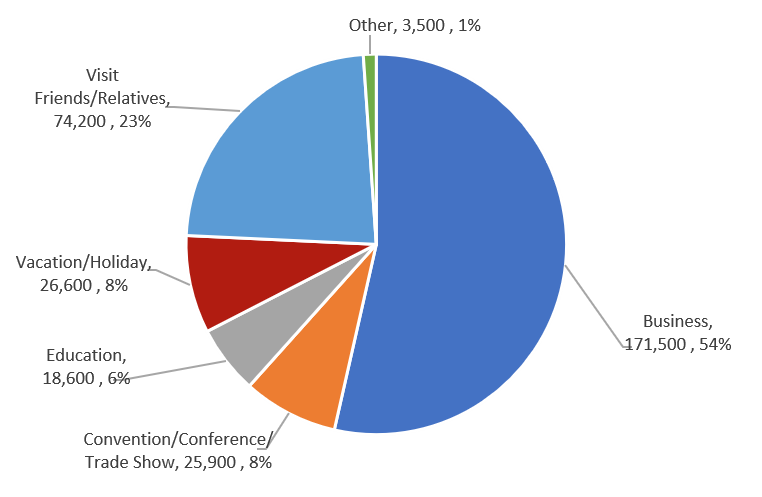
However, the profile of Chinese travellers to the U.S. has changed significantly in the intervening years. The following chart illustrates the breakdown of visitors by primary purpose of trip. To illustrate the traveller profile in the early 2000s, we have used data for 2005, the earliest year for which the detailed breakdown is available. The “Other” category includes health treatment, religious pilgrimages, and other reasons for visitation that are not depicted in the chart.
However, the profile of Chinese travellers to the U.S. has changed significantly in the intervening years. The following chart illustrates the breakdown of visitors by primary purpose of trip. To illustrate the traveller profile in the early 2000s, we have used data for 2005, the earliest year for which the detailed breakdown is available. The “Other” category includes health treatment, religious pilgrimages, and other reasons for visitation that are not depicted in the chart.
Main Purpose of Chinese Travel to U.S. - 2005
 Source: U.S. Department of Commerce, National Travel and Tourism Office
Main Purpose of Chinese Travel to U.S. - 2018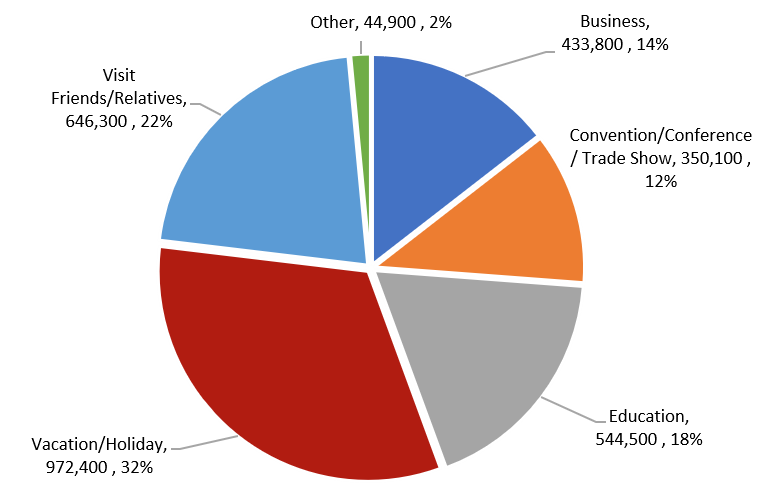 Source: U.S. Department of Commerce, National Travel and Tourism Office
Main Purpose of Chinese Travel to U.S. - 2018
All segments will be affected during the period in which travel restrictions are in effect. How quickly each segment recovers once the restrictions have been lifted will likely differ, depending on the purpose of the trip. Business travellers are likely to be among the first to resume traveling, as the lull in travel will presumably make resuming their business activity a priority. The Vacation/Holiday category and the Visit Friends/Relatives category both reflect travel that is typically discretionary. As a result, the timing and pace of the recovery of these segments will likely be more influenced by the perspective of individual travellers. On a positive note, a significant proportion of the Vacation/Holiday segment comprises group tours, and the entities that run these tours can be expected to push to restore their businesses as soon as possible. Finally, the Education segment is the least likely to be affected, largely for reasons of logistics. Given the timing of the outbreak, it is reasonable to assume that most Chinese students attending U.S. schools were already here, and they are unlikely to return to China during the semester or even over the summer. Thus, unless the outbreak and restrictions continue until the fall semester, this segment will likely demonstrate minimal impact.
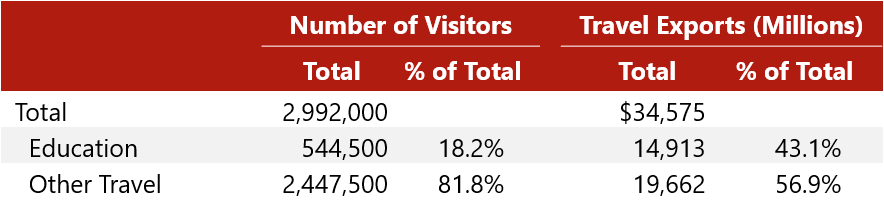
Turning to the question of economic impact, the outlook for the education sector suggests some good news. Although individuals traveling for education represented only 18.2% of total travellers in 2018, the value of their spending comprised over 43% of the total travel exports. To the extent that impact on the education sector is minor, so too would be the impact on the spending by these travellers. However, the remaining $19.7 billion in travel exports is generated by all other sources of travel (further breakdowns are not available) and would be vulnerable to impact on the segments that comprise this category.
Turning to the question of economic impact, the outlook for the education sector suggests some good news. Although individuals traveling for education represented only 18.2% of total travellers in 2018, the value of their spending comprised over 43% of the total travel exports. To the extent that impact on the education sector is minor, so too would be the impact on the spending by these travellers. However, the remaining $19.7 billion in travel exports is generated by all other sources of travel (further breakdowns are not available) and would be vulnerable to impact on the segments that comprise this category.
Inbound Travel to the US from China: Visitors and Spending 2018
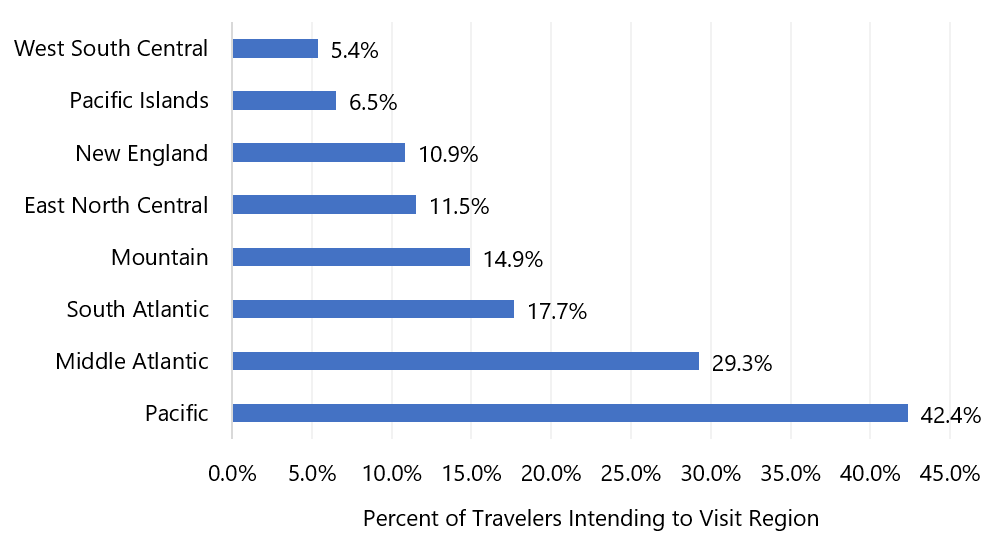
Just as certain segments may be more vulnerable to the impact of the pandemic, certain regions of the U.S. are also more likely to be affected. The following graph illustrates the breakdown of visitors by regions visited. Some visitors’ travel plans included multiple destinations, accounting for the total of greater than 100%.
2018 Inbound Chinese Travelers - Destination by Region
 Source: U.S. Department of Commerce, National Travel and Tourism Office
While Chinese tourists visit all regions of the country, the Pacific and Mid-Atlantic regions are the most popular destinations. Within the Pacific region, most visitors indicated Los Angeles (23.4%) and San Francisco (14.1%) as their primary destination. New York City was cited as the destination by 24.5% of the 29.3% of visitors to the Mid-Atlantic region. Within the other regions, the major metropolitan areas were the primary destination, including Las Vegas (10.3% of the Mountain region), Boston (8.8% of the New England region) and Washington, D.C. (7.6% of the South Atlantic region).
Another factor that warrants consideration is the length of stay. Given the distance to the U.S. from China, most visitors plan a relatively long trip. According to a McKinsey & Company report entitled Chinese Tourists: Dispelling the Myths, published in September 2018, 55% of Chinese visitors stay eight to 13 days, and 21% stay for longer than 13 days. Based on the data, every visitor that does not travel to the U.S. due to the pandemic could equate to multiple room nights, exacerbating the impact on the hotel industry.
Another factor that warrants consideration is the length of stay. Given the distance to the U.S. from China, most visitors plan a relatively long trip. According to a McKinsey & Company report entitled Chinese Tourists: Dispelling the Myths, published in September 2018, 55% of Chinese visitors stay eight to 13 days, and 21% stay for longer than 13 days. Based on the data, every visitor that does not travel to the U.S. due to the pandemic could equate to multiple room nights, exacerbating the impact on the hotel industry.
Conclusion
Ultimately, the impact of the coronavirus on the global travel industry will depend on the course of the pandemic, the extent and duration of travel restrictions and, perhaps most significantly, the media’s coverage of, and the traveling public’s response to, these events. Clearly, the U.S. lodging industry and other sectors that benefit from travel and tourism will be negatively affected; some markets are already feeling this impact.
Over the longer term, however, the outlook is more optimistic. As is illustrated by travel patterns following prior pandemics, the volume of travel can recover relatively quickly. Moreover, China continues to be a significant source of tourism for the U.S., with the potential to generate substantially more visitors and economic impact than recorded in recent years. As the trade issues continue to be resolved, the U.S. can expect to participate in this expanding market.
Over the longer term, however, the outlook is more optimistic. As is illustrated by travel patterns following prior pandemics, the volume of travel can recover relatively quickly. Moreover, China continues to be a significant source of tourism for the U.S., with the potential to generate substantially more visitors and economic impact than recorded in recent years. As the trade issues continue to be resolved, the U.S. can expect to participate in this expanding market.