Introduction
In 2018/19, the national lodging market continued to climb to new heights, albeit at a more moderate pace than in previous years. In 2018, hotels in the United States operated at the highest occupancy and average rates ever recorded, with both metrics registering additional growth during the year-to-date July 2019 period. While the pace of new hotel development and the entrance of new supply has remained tamed when compared with the previous cycle, this pace has been accelerating, as evidence by increases in supply in 2018 and 2019, as well as the number of hotel rooms under construction as of mid-year 2019. Through year-end 2018, the lodging sector was able to absorb increases in supply, showing signs of healthy supply/demand balance, with national demand levels growing similar to or just above the rate of new supply increases. However, the pace of absorption of new supply slowed in the year-to-date 2019 period, with many markets reporting relatively flat occupancy levels, and the top 25 markets even showing negative growth in occupancy. Meanwhile, the same cannot be said for construction costs, which have continued to rise exponentially over the last few years. As such, while developers continue to pursue hotel development in order to capitalize on what has historically been a healthy lodging market, the recent deceleration of RevPAR growth, coupled with rising construction costs, continues to challenge the feasibility of new hotel projects.
HVS has tracked hotel development costs for the last three decades, collecting data from actual hotel cost budgets during our assignments. This 2018/19 survey reports per-room hotel development costs based on data compiled by HVS from hotel projects proposed or under construction during the 2018 calendar year. The data reflect nine product categories: budget/economy, limited-service, midscale extended-stay, upscale extended-stay, dual-branded, select-service, full-service, and luxury hotels, as well as redevelopment projects. Although we separated lifestyle/soft-branded hotels into a separate category in prior years, this year we opted to categorize these hotels into one of the nine categories above in order to focus on illustrating the results by product type.
The HVS U.S. Hotel Development Cost Survey sets forth averages of development costs in each defined lodging product category. The survey is not meant to be a comparative tool to calculate changes from year-to-year, but rather, it reflects the actual cost of building hotels across the United States in 2018. As will be discussed, the median and averages set forth in this survey are greatly affected by the types and locations of hotels being developed at this point in the development cycle. Our goal in sharing this publication is to provide a basis for developers, investors, consultants, and other market participants in evaluating hotel development projects. Given that development costs for hotels are dependent on a multitude of factors unique to each development and location, this report should not be relied upon to determine the cost for actual hotel projects or for valuation purposes, but rather, it is intended to provide support for preliminary cost estimates, as well as to show a comparison across the various hotel categories.
Supply-and-Demand Dynamics Allowing For Increased Hotel Development
The year 2018 served as another period of growth for hotel occupancies and average rate (ADR). STR reported national year-end 2018 occupancy and ADR at 66.2% and $129.87, respectively. In the year-to-date period through July 2019, both metrics were reported at 67.1% and $131.85; this reflects a 0.1% and 1.1% increase in occupancy and ADR, respectively, compared to same year-to-date period in 2018. It also shows that the rate of year-over-year growth in 2019 is slowing, particularly from an occupancy perspective, suggesting that national occupancies have reached a peak for the current cycle.
Exhibit 1: U.S. Occupancy, Average Rate, and RevPAR
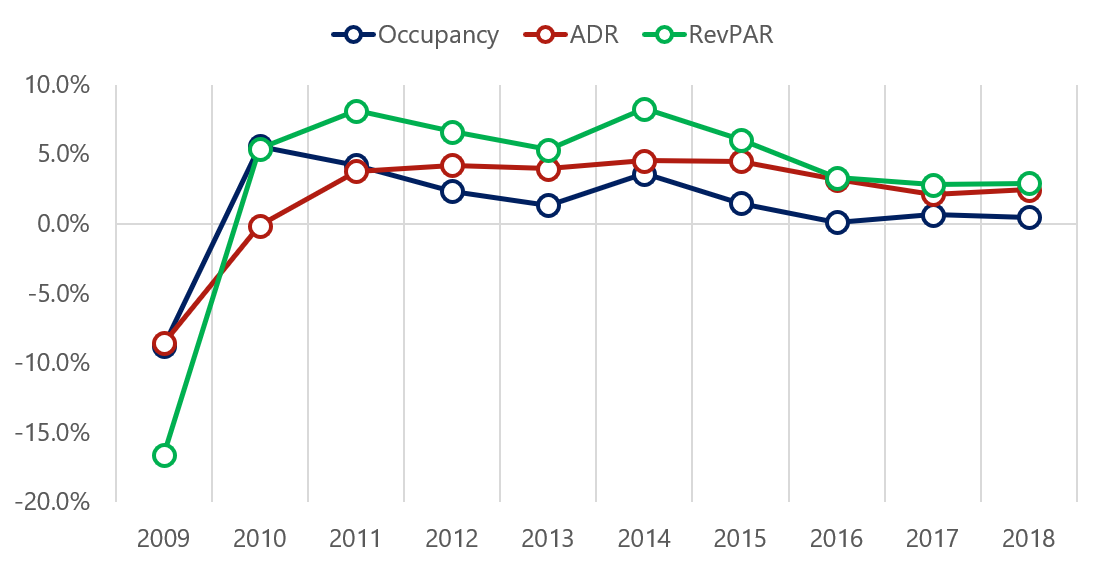
Source: STR
Minneapolis, Miami, Philadelphia, Phoenix, San Diego, and Philadelphia illustrated the strongest rates of RevPAR growth in 2018. All major markets across the country also noted higher demand levels, with the exception of Houston, which registered negative RevPAR given the increase in supply, coupled with negative trend in demand growth, as the market restabilized following a surge of demand associated with Hurricane Harvey in 2017. Important to note, however, is that the entrance of new supply has not been evenly distributed across markets over the last two years. The top 25 markets experienced supply increases in excess of demand, while in all other markets, demand generally outpaced supply. This illustrates that most new hotel development continues to occur in the largest markets. While secondary markets may illustrate positive supply-and-demand dynamics, in 2018, overall RevPAR for secondary markets was $44 lower than in the top 25 markets. While the feasibility of new development may be challenging enough in strong markets, it may be equally challenging to pencil new development in secondary or tertiary markets given these areas’ lower RevPAR levels.
Supply growth typically lags the market because of the time it takes for projects to become feasible and get financed and developed. Supply growth peaked in the last cycle at 2.4% and 2.8% in 2008 and 2009, respectively, as many projects that opened during that time had started construction in late 2007 or early 2008. However, the pace of growth in new supply slowed substantially to an annual average of 0.6% from 2011 through 2015. In the early post-recession years, hotel revenue, net operating income (NOI), and values had declined to a level that did not support new construction. Once RevPAR and NOI had reached a point supporting feasibility, it took several years for projects to get financed and constructed. The pace of new supply increased to 1.5%, 1.5%, and 2.0% in 2016, 2017, and 2018 respectively, reflecting the resurgence of hotel openings in those years, as illustrated below.
Exhibit 2: Historical and Proposed New Supply
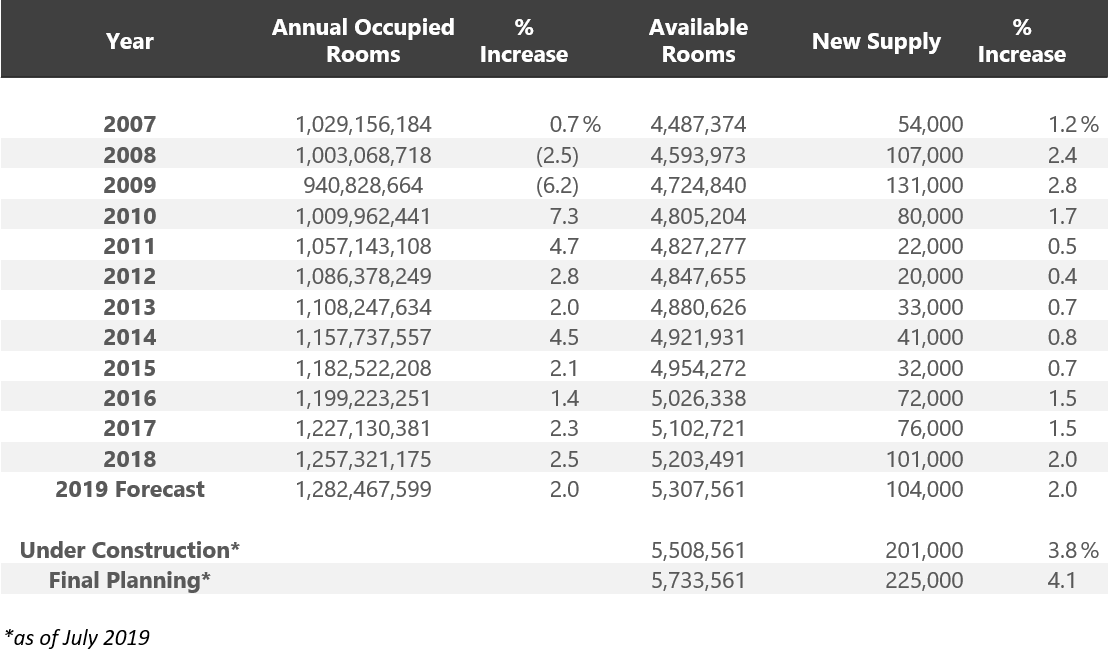
Source: STR, AHLA
The 2.0% increase in supply in 2018 represented approximately 102,000 new hotel rooms; new supply growth is projected to increase by 2.0% by year-end 2019. In 2018, the markets with the highest supply growth included Boston, Dallas, Denver, Nashville, and Seattle. These markets reported new supply increases of over 4.0%.
According to the American Hotel & Lodging Association (AHLA), as of July of 2019, 201,000 new hotel rooms were under construction across the country, representing an imminent supply increase of 3.8% over an 18-month period. Additionally, at the same time, 225,000 rooms were in the final planning stages and expected to begin construction within the next twelve months. As such, the data indicate that the pace of hotel development and new supply may continue a momentum of approximately 2.0% to 2.5% annual growth in the next two to three years, at a pace similar to the last peak of the development cycle in 2008/09. However, it is important to note that actual supply growth may be less than suggested by the data above, as slowing RevPAR growth, coupled with the rapid increase in construction costs, will cause developers to delay some projects indefinitely (or cancel them altogether), as competition for construction labor and materials among various product types, such as commercial, residential, and public works, continues to increase.
Exhibit 3: U.S. Percentage Change In Supply and Demand
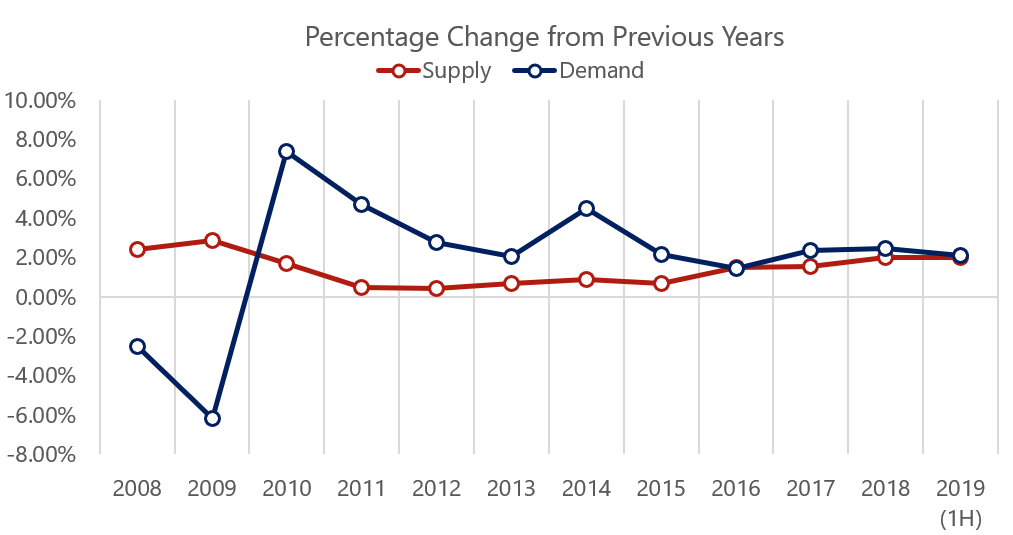
Source: STR
Given the pace of new supply growth, it is important for market participants, including hotel developers, lenders, and consultants, to exercise caution and discipline when considering new projects. Following a decade of consecutive growth since 2009, it can be agreed that we have reached the top of the cycle in terms of hotel occupancy. The nation’s lodging sector has never operated consistently with occupancies higher than those realized in 2018; moreover, the year-to-date performance supports this claim, with hotel occupancies remaining perfectly flat when compared with the corresponding data during the same period last year. As such, since 2016, RevPAR growth has been mostly generated by an increase in ADR, which has been limited by increases in inflation and kept at bay by steady increases in supply. Thus, the national hotel market has been operating at a point of general equilibrium since 2016, with both supply and demand in balance, and revenues growing at a pace similar to inflation.
After realizing RevPAR growth of $83.50 in 2017 and $85.90 in 2018, respectively, year-to-date trends suggest the lodging sector will achieve RevPAR growth just slightly above 1.0% in 2019, the slowest since the Great Recession and below the rate of inflation. With new supply anticipated to enter the market at a pace of 2.0% annually, market participants are expecting performance levels to continue to slow, making the feasibility of new projects challenging in today’s environment. With that being said, hotel development can often take three to five years to come to fruition, and as evidenced in the years immediately following the Great Recession, new supply is typically slow to enter the market following a period of correction. Developers often mention that the slower periods can be the best time to begin construction and position a project to open and take advantage of a future up-cycle. Additionally, construction costs can often decrease during a period of correction, which could improve project feasibility if developers have the wherewithal to begin their projects during a slowdown.
Macro Environment
From a macroeconomic perspective, current U.S. unemployment levels are now firmly below the annual averages of the last economic cycle peak of 2006 and 2007, when annual averages were 4.6%. The U.S. economy expanded at an overall rate of 2.9% in 2018, compared to 2.2% in 2017, the highest growth registered since 2015. After a slow end to 2018, with 1.1% growth in the fourth quarter, growth rebounded to 3.1% and 2.0% in the first and second quarters of 2019, respectively. GDP growth in 2018 was stimulated by the Tax Cut and Jobs Act, which was passed in December 2017, driven primarily by fixed investments and strong consumer spending. This growth in U.S. GDP generated steady increases in demand for hotels, as previously discussed, and, as of the time of writing, most signs point to a continuation of the expansion. However, thus far in 2019, uncertainty and volatility have also increased, with economic growth starting to show signs of deceleration in some sectors. National concerns also include rising trade tensions between the U.S. and China; increasing levels of both government debt and corporate debt; a deceleration in the auto, energy, construction, and housing sectors; volatility in the stock market; and lower bond yields that continue to signal that investors are cautious of the future.
As it relates to hotel development, issues related to low unemployment, creating an increase in labor costs and a decrease in the availability of labor in general, as well as the implementation of tariffs, have remained at the forefront of discussions for developers given rising construction costs associated with both labor and materials. According to the Turner Building Cost Index, which has tracked costs in the non-residential building construction market in the United States since 1967, the index increased by 5.6% in 2018 and by 5.4% in the 2018/19 trailing twelve months ending in June 2019. According to Turner, the index has increased year-over-year since 2011, significantly outpacing inflation since 2012. Rider Levett Bucknall (RLB), which also provides a quarterly construction cost report, illustrated a rise in its construction cost index of approximately 5.2% in 2018, with metropolitan areas such as San Francisco, Chicago, Seattle, Portland, and Phoenix reporting increases between 6% and 7% per year. The Turner Building Cost Index is determined by the following factors on a nationwide basis: labor rates and productivity, material prices, and the competitive condition of the marketplace. The change in the Turner Construction Cost Index compared with the change in the Consumer Price Index (CPI) during the same period is illustrated in the following graphic.
Exhibit 4: Percentage Change In Consumer Price Index vs. Turner Cost Index
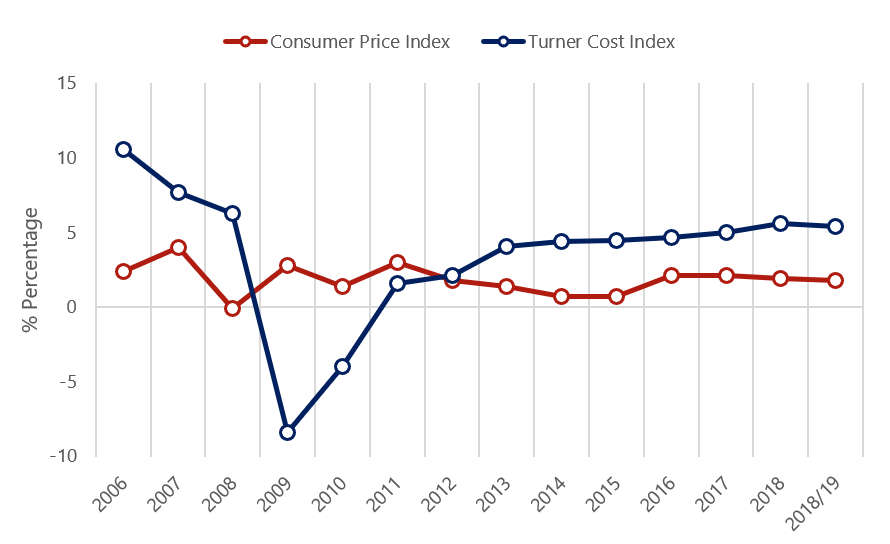
Source: U.S. Bureau of Labor Statistics, Turner Building Cost Index
Long-term construction inflation is normally double that of consumer inflation. Since 2012, the rate of change in the Turner Cost Index has outpaced the rate of inflation, illustrating how construction costs continue to rise at a steady pace. The gap between general inflation and construction inflation is becoming more pronounced; in the last 18 months, the nation experienced a general deceleration in inflation growth, while this was not the case in the construction sector.
With national unemployment registering 3.9% by year-end 2018 and decreasing further to 3.7% in 2019, the primary driver of increase in construction costs remains the significant shortage in skilled labor. According to the Bureau of Labor Statistics, construction employment increased by approximately 300,000 by year-end 2018, compared with a gain of 270,000 in 2017. Despite the gain in construction jobs, 382,000 construction jobs remained unfilled by year’s end, significantly higher than the 149,000 unfilled jobs in the prior year, illustrating the continued dearth of labor in the construction sector. A survey by the Associated General Contractors of America (AGCA) cites 78% of construction firms report difficulty hiring construction workers. This appears to be a combination of factors, including experienced workers retiring, low unemployment, and younger workers opting for other careers or pursuits in higher education. On the other hand, technology improvements and the use of “big data” continue to enable efficiencies in the use of time, money, and resources in the construction industry, primarily as it relates to design and planning.
While construction wages increased at a pace of 2.8% in 2018, the cost of materials increased significantly, with material costs increasing at a pace of nearly 10%. Several key materials and resources increased more rapidly, including oil, iron, steel, lumber, aluminum, and asphalt paving mixtures. A scarcity of resources due to natural disasters nationwide and a rise in construction activity have been attributed to rising costs. Another factor in the increase in material costs is international trade considerations. In 2018, a 10% tariff on $200 billion of Chinese goods was implemented by President Trump, which affected some materials, namely steel and aluminum. This tariff of $200 billion of goods was increased to 25% in May 2019, and another tariff of 10% on additional goods took effect in September 2019. In 2018, customers fearing that the cost of steel would rise and reduce supply, as an example, purchased excess product, which also increased prices further. The supply concerns never took place, and these customers began working off their existing inventory, which then reduced demand for steel and thus lowered prices once more in 2019. The same has been true for other materials, which suggest we may actually see a moderation in the price of some materials in 2019.
Hotel Development Cost Categories
Evaluating the completeness of a hotel development budget can often be challenging, as different line items are used, and some components are unintentionally omitted. HVS has been at the forefront of assisting developers and industry participants make sense of hotel development costs through the consistent presentation of these costs. Based on our experience in reviewing actual developers’ budgets, as well as preparing the annual HVS U.S. Hotel Development Cost Survey, we have developed the following summary format for hotel development budgets, which forms the basis for the presented cost categories. We find that these categories are meaningful for hotel professionals when undertaking an analysis relating to hotel feasibility, and they provide a basis from which to analyze proposed projects. This year we have elected to separate costs associated with a developer’s fee given its increasing prominence as a line item in hotel development budgets. The following illustration shows the six categories defined by HVS, as well as the typical items associated with each category.
Exhibit 5: HVS Hotel Development Cost Categories
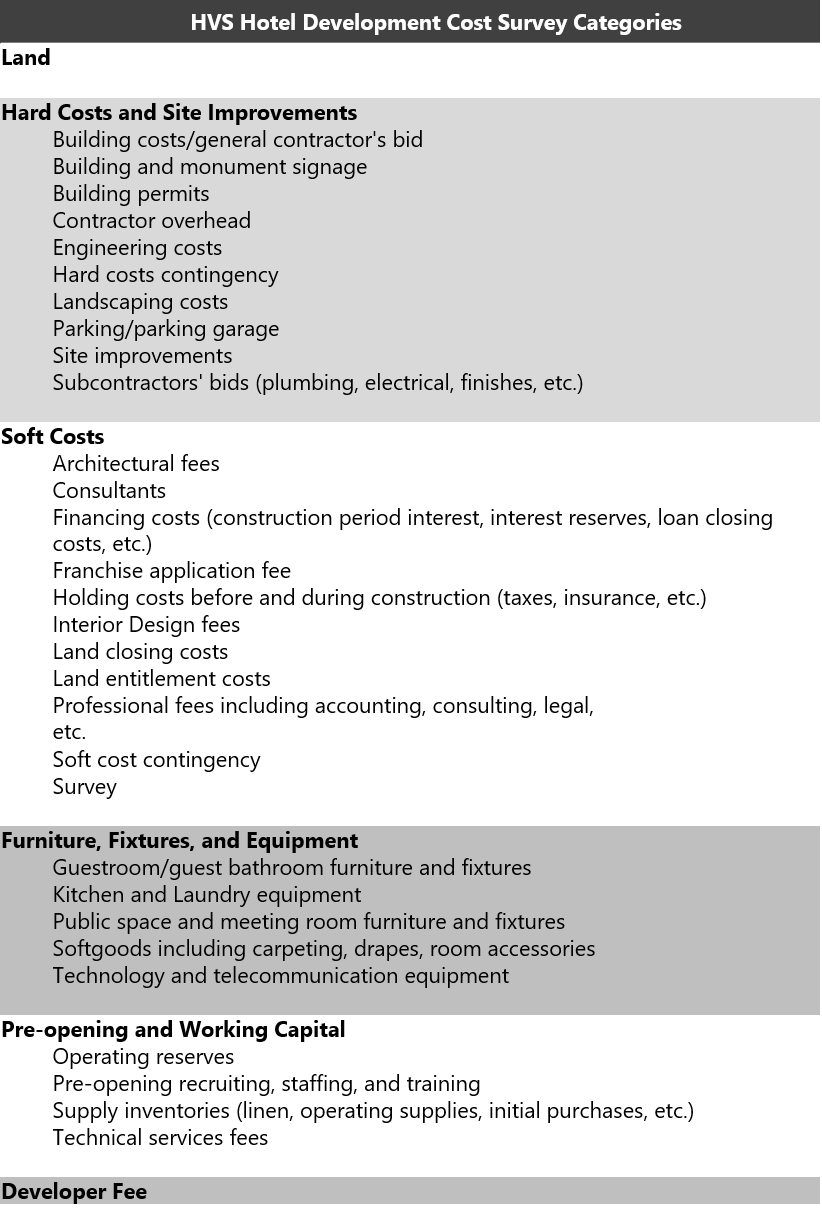
Source: HVS
The categories are not meant to be all-encompassing but do reflect the typical items in a development budget. In construction accounting, development budgets are generally presented in far greater detail than for general investment analysis.
Data Collection and Sample Size
In 2018, HVS collected actual hotel construction budgets across nearly all 50 states. While not every construction budget was captured (due to a variety of reasons, including incomplete data, skewed data, or development attributes), our selection includes complete and reliable budgets that form the basis for this year’s survey. The budgets included projects that reflected both ground-up development and the redevelopment of existing buildings throughout the United States. The top ten states most represented in the survey were California, Colorado, Florida, Georgia, Illinois, Indiana, New York, North Carolina, and Texas, illustrating where the bulk of hotel development is occurring in the country. Furthermore, as can be expected, construction costs vary greatly in different parts of the country. We are often asked to segment the data further by geographical regions; however, the number of states, coupled with the number of hotel product categories, would segment the data so much that the results would not be meaningful, as there are just not that many hotels built each year across the country to generate meaningful and robust results for each region and for each category. Nevertheless, in this sample, the highest construction costs per key, as would be expected, were for projects in New York City, while select high-barrier-to-entry markets in California, Texas, and Florida also exhibited high costs per room. Conversely, the lowest costs per room were evident for limited-service hotels in highway-adjacent, rural, or tertiary markets throughout the country.
Lastly, we also examined the lodging product tier (STR chain scale) breakdown of our data set against the national data from STR. According to STR, approximately 65% of all hotel rooms planned to open over the next three years in the U.S. are categorized as upper-midscale or upscale. By comparison, our five categories that include upper-midscale to upscale product comprised 69% of our total sample size; as such, our data are considered representative of the development pipeline for the nation.
Per-Room Hotel Development Costs
The averages and medians below reflect a broad range of development projects across the U.S., including projects in areas with low barriers to entry and in high-priced urban and resort destinations.
Exhibit 6: Hotel Development Cost Per Room Amounts
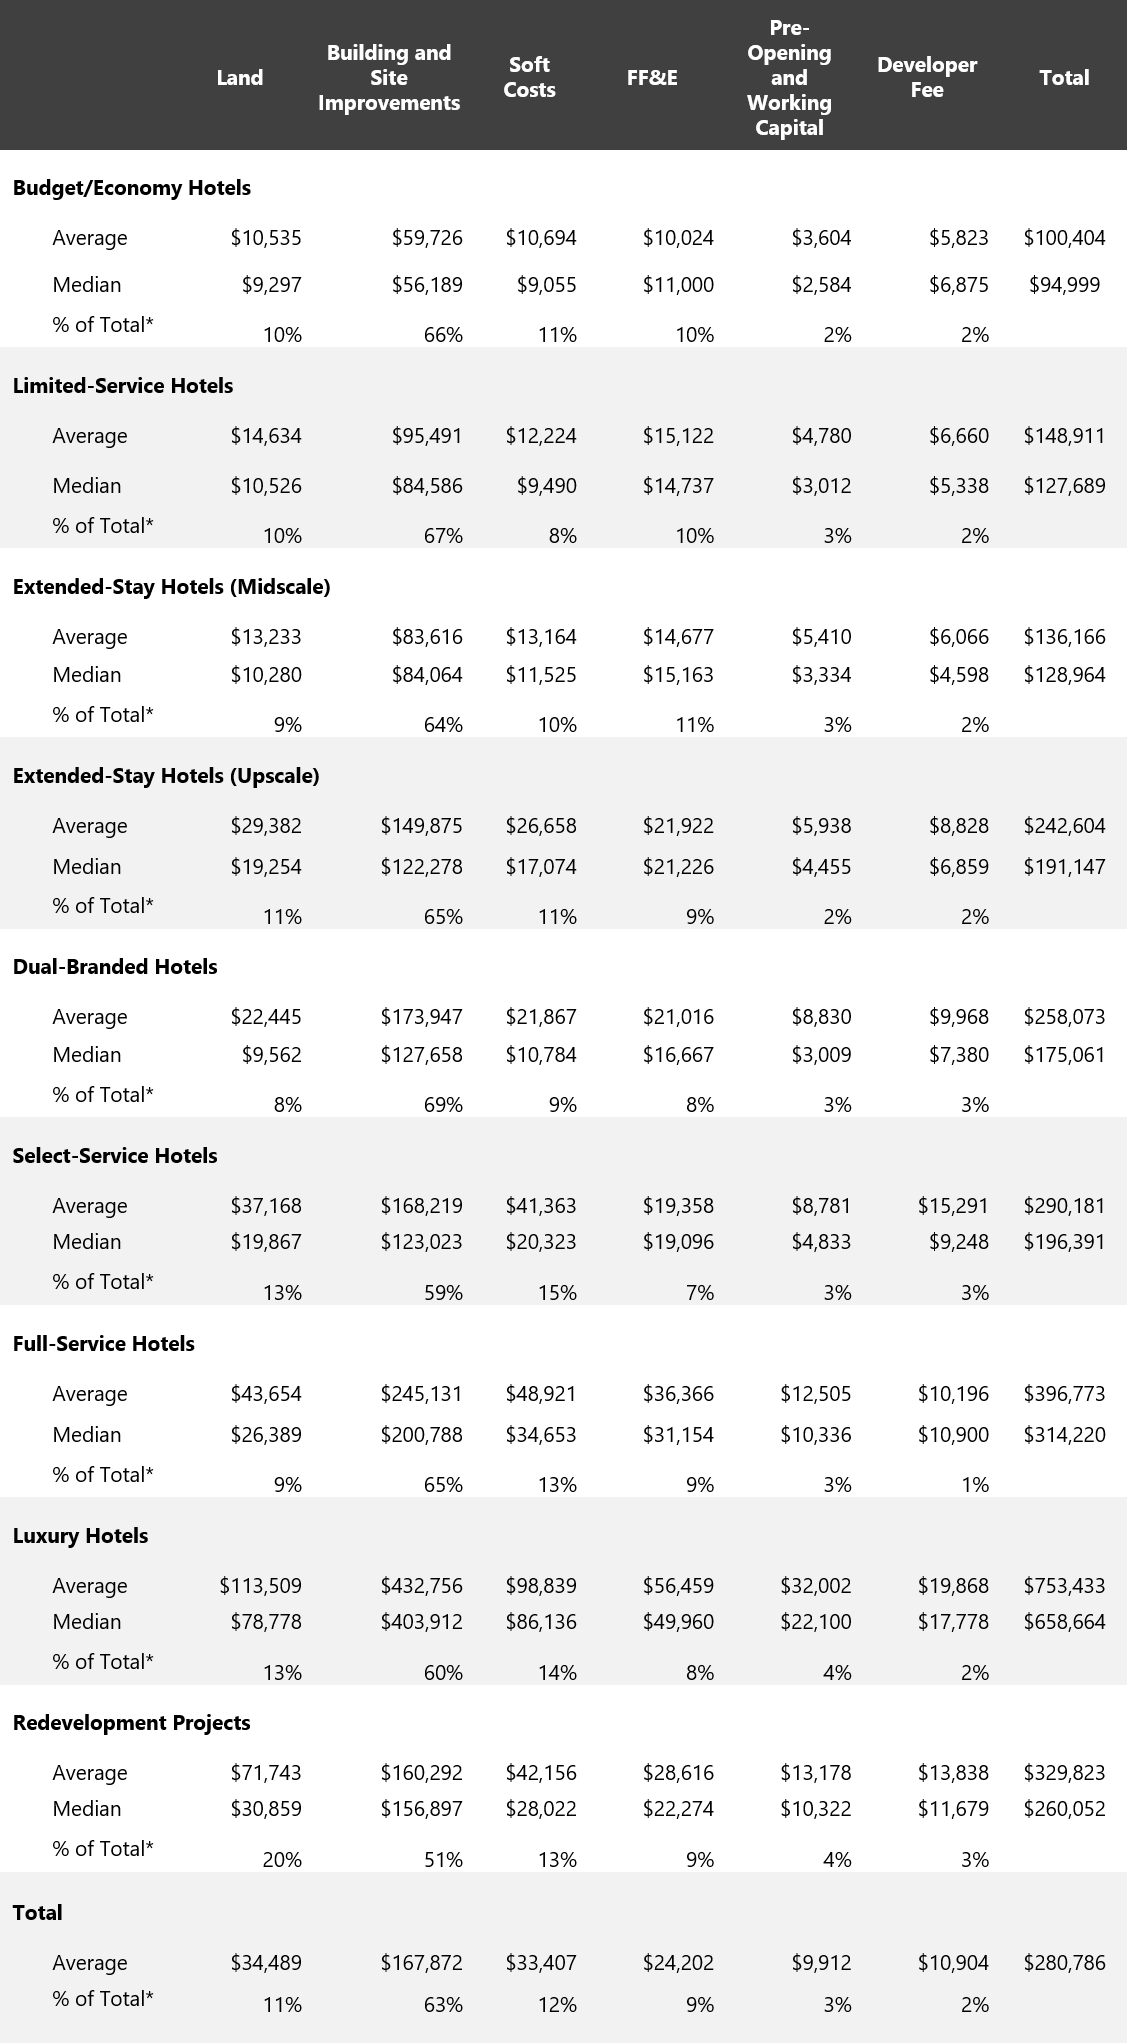
Source: HVS
* The percentage of total is calculated based on the total sample of all budgets.
As illustrated above, budget/economy hotels averaged a development cost of $100,000 per room in 2018. The most popular brands in this category included Microtel and Days Inn hotels. However, it should be noted that this was the category with the least development activity in our survey, as the land and construction costs necessary to develop this product are not typically justified by the revenue potential; thus, new construction is often not feasible.
Limited-service and midscale extended-stay hotels illustrated average costs per rooms in the mid-$100,000s and represented the most popular product type, with nearly 50% of the projects in our survey falling in these two categories. The most popular brands in these categories included Fairfield Inn by Marriott, Home2 Suites by Hilton, Tru by Hilton, and Holiday Inn Express.
Upscale extended-stay, select-service, and dual-branded hotels had similar average costs per rooms, in the mid-to-high $200,000s. These categories included popular brands such as Courtyard by Marriott, AC by Marriott, Hyatt Place, Hyatt House, SpringHill Suites by Marriott, and Hilton Garden Inn.
Quite noticeable is the disparity in development costs from select-service to full-service, with this product type costing, on average, $100,000 more per room than a select-service hotel. Autograph Collection, Tapestry Collection by Hilton, Embassy Suites, and Westin were some of the common names in our full-service list.
Lastly, the cost to develop luxury hotels continues to increase, with this product costing, on average, nearly $800,000 per room. The most expensive hotel in our survey, which is currently under construction, has a development cost of $1.8 million per room.
Over the last 43 years that HVS has conducted the development cost survey, a trend has remained, which is worth illustrating further, and this is the general consistency of the percentages of development costs per category across all product types, as illustrated above. The one exception, as would be expected, is for the redevelopment category, where site acquisition costs are noticeably higher and site-improvement costs are lower. With this information we believe developers are now increasingly able to find the support necessary to estimate total costs for individual projects; particularly, if the two most important factors, land costs and building and site-improvement costs, have been determined, as these two cost categories add up to approximately 70% to 75% of a hotel’s total development budget. Based on the results of this year’s survey, a summary of how costs are allocated across all categories is set forth below.
Exhibit 7: Hotel Development Costs as a Percentage of Total Costs
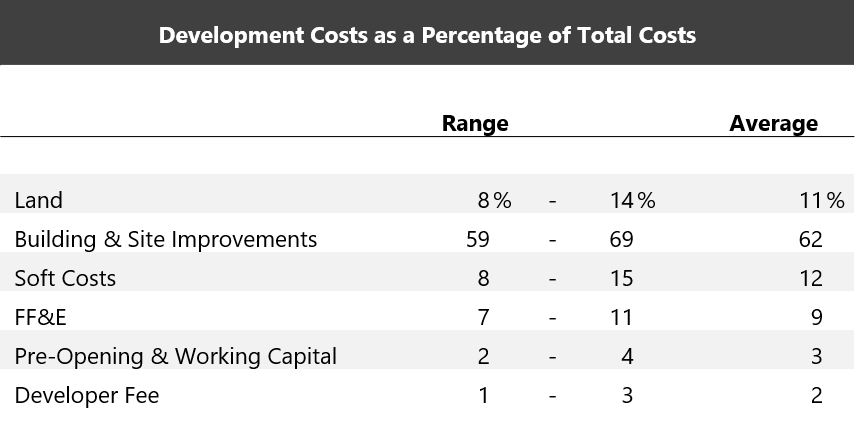
Source: HVS
Conclusion
The budgets analyzed in this survey are provided directly by the developers, owners, and lenders on both ground-up and conversion hotel projects during the course of an entire year. The results of the survey combine the data from actual construction budgets organized across a variety of product types. The results also comprise unique hotel projects that cannot be replicated by the inherent nature of hotel development. As such, we would caution developers on relying on the information to estimate costs for a specific project, as a multitude of factors affect a hotel’s development budget. Thus, we recommend that users of the HVS U.S. Hotel Development Cost Survey consider the per-room amount in the individual cost categories only as a general guide for that category. Construction companies are the best sources for obtaining hard costs and FF&E costs for a specific hotel project. It is also advised that developers consult more than one source in their hotel development process to more accurately assess the true cost of development. Additionally, cost should always be adjusted for inflation over the development timeline given that the typical hotel development process can last three to five years. Lastly, we recommend that the projected performance of the proposed hotel be revisited periodically during the development process.
All individual property information used by HVS for this cost survey was provided on a confidential basis and deemed reliable. Data from individual sources are not disclosed.