Introduction
In 2017/18, the national lodging market continued to climb to new heights. In 2017, hotels in the United States operated at the highest occupancy and average rates ever recorded, with additional growth across both metrics in the 2018 year-to-date period. Hotel development activity correlates directly with the ebbs and flows of hotel-sector performance. As the market continued to reach a new peak for the current development cycle in 2017, developers pursued hotel construction and redevelopment at a pace not seen since 2006 and 2007, and the pipeline of new hotel projects gained momentum. HVS has tracked hotel development costs for the last three decades, collecting data from actual hotel cost budgets during our assignments. This year’s sample reflects the largest sample HVS has analyzed given the number of hotels in the pipeline, as well as our growing presence in 40 U.S. markets. This 2017/18 survey reports per-room hotel development costs based on data compiled by HVS from hotel projects proposed or under construction during the 2017 calendar year. With the availability of more data, we elected to add a redevelopment category to account for projects that did not include ground-up construction, such as those that involved a complete renovation, conversion, or adaptive reuse. Thus, our data now reflect ten product categories: budget/economy, limited-service, midscale extended-stay, upscale extended-stay, dual-branded, select-service, full-service, lifestyle/soft-branded, redevelopment, and luxury hotels.
The HVS Hotel Development Cost Survey sets forth averages of development costs in each defined lodging product category. The survey is not meant to be a comparative tool to calculate changes from year-to-year, but rather, it reflects the cost of building hotels across the United States in 2017. As will be discussed, the averages set forth in this survey are greatly affected by the types and locations of hotels being developed at this point in the development cycle. Our goal in sharing this publication is to provide a basis for developers, investors, consultants, and other market participants in evaluating hotel development projects. Given that development costs for hotels are dependent on a multitude of factors unique to each development and location, this report should not be relied upon to determine the cost for actual hotel projects or for valuation purposes, but rather, it is intended to provide support for preliminary or actual cost estimates, as well as to show a comparison across the various categories.
Supply and Demand Dynamics Allowing for Increased Hotel Development
Without a doubt, 2017 served as another banner year for hotel occupancies and average rate (ADR). STR reported national year-end 2017 occupancy and ADR at 65.9% and $126.72, respectively, with both metrics increasing to 67.7% and $130.37 in the year-to-date period through September; this reflects a 0.5% and 2.5% increase in occupancy and ADR, respectively, when compared to same year-to-date period in 2017. Except for a few markets, such as Chicago, Minneapolis, and Orlando, where RevPAR levels were negatively affected by an increase in supply that exceeded demand, most U.S. markets experienced the exact opposite in 2017. Demand levels across the country generally exceeded increases in supply, which, coupled with rising ADRs, resulted in higher RevPAR levels across the country, as illustrated below.
EXHIBIT 1: U.S. Occupancy, Average Rate, and RevPAR
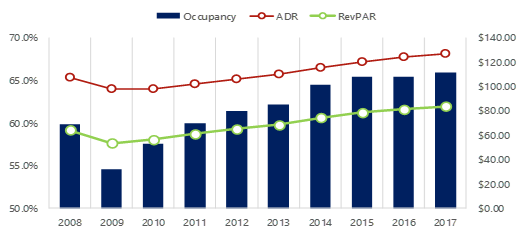
Source: STR
A deeper look at the supply-and-demand picture across the nation helps to explain the rise in these metrics. While the number of rooms available in the U.S. increased by 6.5% from 2010 through 2017, or an average of 0.9% annually, overall rooms sold grew by approximately 22%, or an average of 2.8% annually, during the same period, resulting in the rising occupancy and ADR levels that the nation is now experiencing and that is ultimately translating into higher RevPARs.
EXHIBIT 2: U.S. Supply and Demand
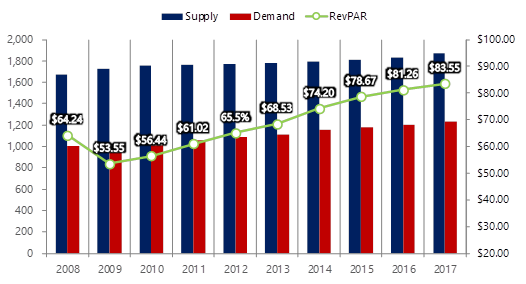
Source: STR
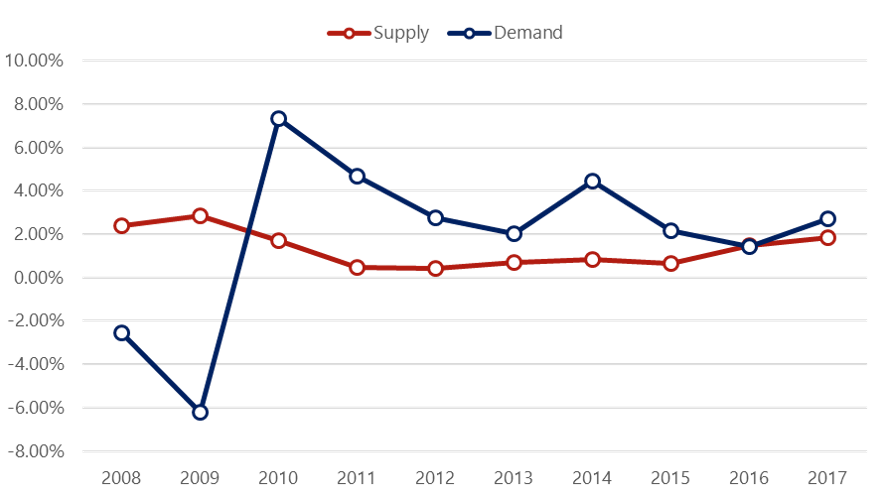
Following these eight years of consecutive growth since 2009, analysts agree that we are likely to be reaching the top of the cycle in terms of hotel occupancy. It is these record RevPAR levels that have continued to prompt new hotel development, as the likelihood for the feasibility of a project resulting from increasing revenue and NOI levels is now, more than ever, viable. In 2008 and 2009, new supply entered the market in excess of 2.0% of the prior year’s available supply, as many projects that opened during that time had started construction in late 2007 or early 2008. However, the pace of growth in new supply slowed substantially to an annual average of 0.6% from 2011 through 2015. Yet, as previously shown, accelerating occupancy and ADR dynamics, coupled with the availability of favorable financing, once again increased that pace to 1.5% and 1.8% in 2016 and 2017, respectively, as illustrated below.
EXHIBIT 3: U.S. Change In Supply and Demand
The 1.8% increase in supply in 2017 represented approximately 90,000 new hotel rooms, and the pace of new supply growth continued to accelerate in 2018. According to the American Hotel & Lodging Association (AHLA), as of year-end 2017, 189,000 new hotel rooms were under construction across the country, representing an imminent supply increase of 3.7%. In October 2018, despite the opening of approximately 100,000 hotel rooms over the prior twelve months (a 2.0% increase over the prior year), the number of hotel rooms under construction remained relatively unchanged at 190,000, as proposed hotels moved from the planning phase to the construction phase, further illustrating that the pace of hotel development and new supply growth continues its momentum. In 2017 and 2018, the markets with the highest supply growth included Dallas, Denver, Nashville, NYC, and Seattle. These markets reported new supply increases over 4.0%, more than double the national average.
EXHIBIT 4: Historical and Proposed New Supply
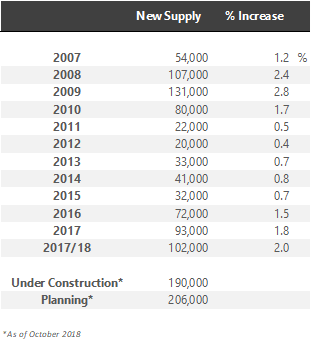
Source: STR, AHLA
Although 190,000 rooms are currently under construction, with an additional 206,000 in the planning phase, these 396,000 rooms will not all enter the market at the same time, but rather over the course of two to four years, as each project completes the development process over the course of time. Furthermore, the rapid increase in construction costs will cause developers to delay some projects indefinitely, or cancel them altogether, as competition for construction labor and materials among various product types, such as commercial, residential, and public works, continues to increase. Nevertheless, assuming most of these projects do enter the market during the next four years, this would represent an average annual supply increase of nearly 100,000 rooms, in line with supply increases over the last two years. While the feasibility of hotel development in some markets may have been previously hindered by stringent financing, high land costs, lower RevPAR levels, or the lack of available brands, these factors have been largely offset by improving dynamics within each of these factors, which is reflected in the increasing numbers of projects under construction or in the planning phase. As an example, while typical loan-to-costs ratios for new hotel development remain near 60% (relatively low when compared to 2006 and 2007), new financing vehicles such as PACE financing or the USDA’s Business & Industry Guaranteed Loan Program have created the possibility for higher leverage for some projects that fit these programs’ requirements. Additionally, options for development have continued to expand as many new brands, some affiliated with the most dominant companies, continue to gain momentum and acceptance with lending institutions.
Macro Environment
The positive momentum experienced thus far, not only in the lodging market, but also in the national economy, has come with at least one headache for hotel developers: the steady increase in labor and construction costs. According to the Turner Building Cost Index, which has tracked costs in the non-residential building construction market in the United States since 1967, the index increased by 5.0% in 2017 and by 5.51% in the 2017/18 trailing twelve months ending in June 2018. According to Turner, the index has increased year-over-year since 2011, outpacing inflation since 2012. Rider Levett Bucknall, which also provides a quarterly construction cost report, illustrated a rise of in its construction cost index of 4.2% in 2017, with metropolitan areas such as San Francisco, Los Angeles, Seattle, Portland, and Chicago reporting increases between 5% and 8% per year. The Turner Building Cost Index is determined by the following factors considered on a nationwide basis: labor rates and productivity, material prices, and the competitive condition of the marketplace. The change in the Turner Construction Cost Index compared with the change in the Consumer Price Index (CPI) during the same period is illustrated in the following graphic.
EXHIBIT 5: Percentage Change In Consumer Price Index vs. Turner Cost Index
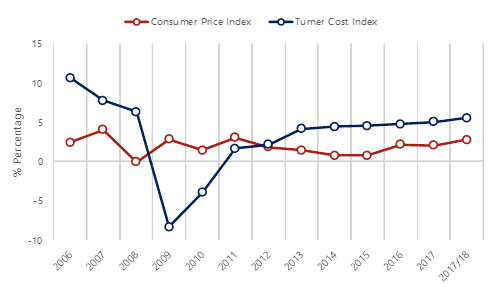
Source: U.S. Bureau of Labor Statistics, Turner Building Cost Index
Long-term construction inflation is normally double that of consumer inflation. Since 2013, the rate of change in the Turner Cost Index has outpaced the rate of inflation, illustrating how construction costs continue to rise at a steady pace. Construction inflation during growth years can accelerate faster, such as those shown in the illustration above. The Turner Cost Index registered increases at a rate of 10.6%, 7.7%, and 6.3% in 2006, 2007, and 2008, respectively. Although we can safely say we are nowhere near those figures yet, construction costs have been slowly creeping upward since 2011 and are now steadily increasing above 5% annually, although certain U.S. markets are experiencing cost increases well above this level.
With national unemployment registering 4.1% for 2017, and decreasing further in 2018, shortages in skilled labor were evident throughout the year. The widespread damage inflicted by the hurricanes in Texas and the Caribbean, along with the record-setting wildfires and mudslides throughout California, further exacerbated the tight labor market in the U.S. during 2017. However, a presidential executive order expanded federally funded apprenticeship programs by redirecting $100 million to industry groups to develop training programs for trade workers. The private sector also stepped in, with The Home Depot Foundation, as an example, investing $50 million into its Home Builders Institute apprenticeship programs. According to the Bureau of Labor Statistics, construction employment increased by 210,000 by year-end 2017, compared with a gain of 155,000 in 2016. Despite the gain in construction jobs, 149,000 construction jobs remained unfilled by year’s end, illustrating the continued dearth of labor in the construction sector. While higher wages typically follow the tight labor market, these increases were not yet fully evident in 2017. Despite construction wages rising the most among all employment categories, these increased only 1.3% in 2017, still below the pace of inflation. On the other hand, material costs increased at a pace of 4% to 6%; a few key materials increased more rapidly, including lumber, steel, aluminum, and cement. It is important to note that the costs of materials in 2017 do not yet reflect the potential impact of the tariffs implemented by President Trump in 2018. However, many remain watchful of the impact that the steel tariff (25%), the aluminum tariff (10%), and the looming trade war with China may have on the cost of materials in 2018 and beyond.
Hotel Development Cost Categories
The Uniform System of Accounts for the Lodging Industry (USALI) provides industry participants with a common language for analyzing the financial performance of a hotel. However, no such system exists for hotel development budgets. Evaluating the completeness of a budget is often challenging, as different line items are used, and some components are unintentionally omitted. Based on our experience in reviewing actual developers’ budgets, as well as preparing the annual HVS Hotel Development Cost Survey, we have developed the following summary format for hotel development budgets, which forms the basis for the presented cost categories. We find that these categories are meaningful for hotel professionals when undertaking an analysis relating to hotel feasibility, and they provide a basis from which to analyze proposed projects. The following illustration shows the five categories defined by HVS, as well as the typical items that each include.
EXHIBIT 6: HVS Hotel Development Cost Categories
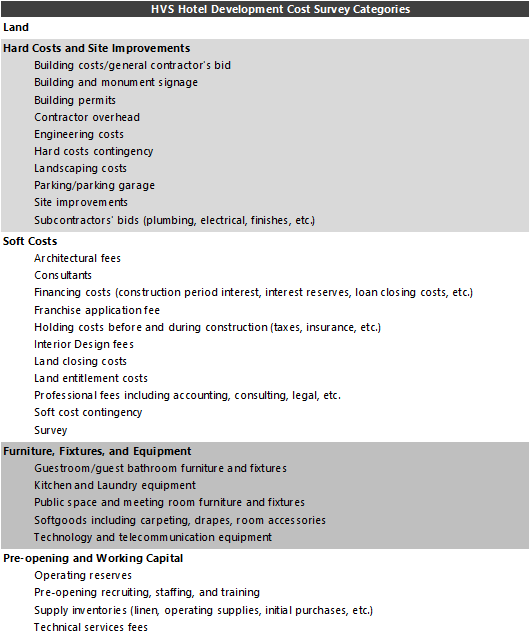
Source: HVS
The categories are not meant to be all-encompassing but do reflect the typical items in a development budget. In construction accounting, development budgets are generally presented in far greater detail than for general investment analysis.
Data Collection and Sample Size
In 2017, HVS collected actual hotel construction budgets across 46 states. While not every construction budget was captured (due to a variety of reasons, including incomplete data, skewed data, or development attributes), the construction budgets sampled span the United States. Furthermore, construction costs vary greatly in different parts of the country. In this sample, the highest construction costs per key, as would be expected, were for projects in New York City, while select high-barrier-to-entry markets in California, Texas, and Florida also exhibited high costs per room. Conversely, the lowest costs per room were evident for limited-service hotels in highway-adjacent or tertiary markets throughout the country.
Our selection includes complete and reliable budgets that form the basis for this year’s survey. The budgets included projects that reflected both ground-up development and the redevelopment of existing buildings. Approximately 10% of the total budgets were for projects where all or a portion of the building was existing; as such, these have now been categorized under a separate “redevelopment” category. When comparing the average cost of redevelopment projects against ground-up projects, as would be expected, redevelopment projects exhibited much higher site-acquisition costs as a percentage of total costs, as the acquisition of the site typically includes both the land and an existing structure. Conversely, for these projects, total construction and site-improvement costs were lower as a percentage of total costs, given that some building and site-improvement cost savings are realized through working with an already existing structure. Because this is the first year for this category, we studied the cost variances further to quantify any potential difference that is generated through redevelopment deals. As illustrated below, for the full-service and lifestyle/soft-branded hotels, which are the most common product types for redevelopment projects, the average cost variance was 11% when compared with ground-up projects. It is important to note that this differential should not be extrapolated to an individual project. In some cases, the cost of redevelopment may exceed the cost of a new build for the same project due to the complexities of adaptive reuse.
EXHIBIT 7: Comparison of Ground-Up vs. Redevelopment Projects
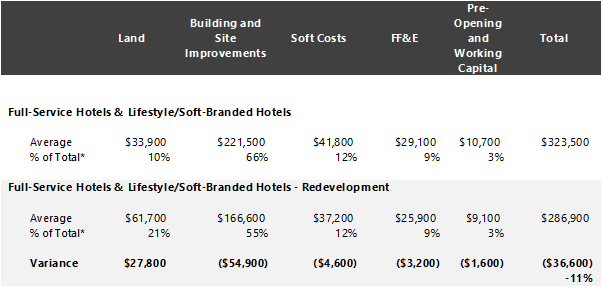
Source: HVS
Lastly, we also examined the lodging product tier (STR chain scale) breakdown of our data set against the national data from STR. According to STR, approximately 65% of all hotel rooms planned to open over the next three years in the U.S. are categorized as upper-midscale or upscale. By comparison, our five categories that include upper-midscale to upscale brands comprised 64% of our total sample size; as such, our data are considered representative of the development pipeline for the nation.
Per-Room Hotel Development Costs
As noted previously, we have changed our categories this year to include hotels that were part of a redevelopment project, as opposed to ground-up construction. The averages reflect a broad range of development projects across the U.S., including projects in areas with low barriers to entry and in high-priced urban and resort destinations.
EXHIBIT 8: 2017/18 Hotel Development Cost Per Room Amounts
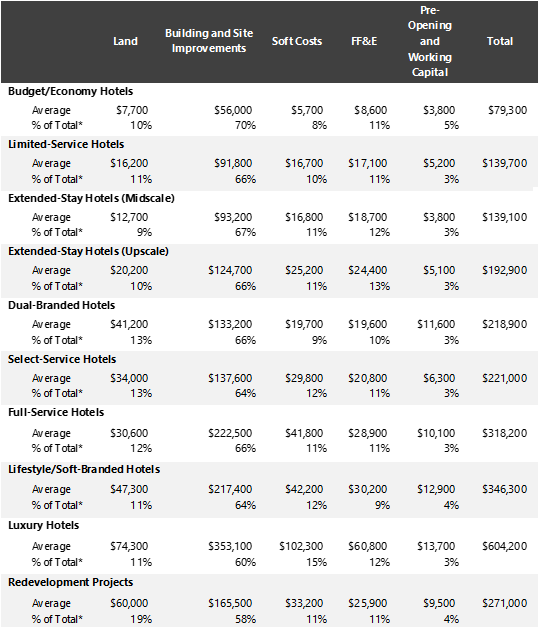
* The percentage of total is calculated based on the total sample of all budgets.
As illustrated above, budget/economy hotels averaged a development cost of nearly $80,000 per room in 2017. However, it should be noted that this was the category with the least development activity in our survey, as the land and construction costs necessary to develop this product are not typically justified by its revenue potential; thus, new construction is often not feasible. Limited-service and extended-stay hotels (midscale and upscale) illustrated average costs per rooms in the mid-to-high $100,000s and represented the most popular product type, with over 50% of the projects in our survey falling in these three categories. Select-service and dual-branded hotels both had similar average costs per rooms, at nearly $220,000. Quite noticeable is the disparity in development costs from select-service to full-service and lifestyle/soft-branded hotels, with the latter product type costing, on average, $100,000 more per room than a select-service hotel. Lastly, the cost to develop luxury hotels continues to increase, with this product costing, on average, just over $600,000 per room; the most expensive hotel in our survey, which is currently under construction, has a development cost of $1.8 million per room.
Over the last 42 years that HVS has conducted the development cost survey, a trend has remained, which is worth illustrating further, and this is the general consistency of the percentages of development costs per category across all ten product types, as illustrated above. The one exception, as would be expected, is for the redevelopment category, where site acquisition costs are noticeably higher and site improvement costs are lower. As such, with this information, we believe developers are now increasingly able to find the support necessary to estimate total costs for individual projects; particularly, if the two most important factors, land costs and building and site improvement costs, have been determined (as these two cost categories add up to approximately 75% of a hotel’s total development budget). Below we present a summary of how costs are allocated across all categories, based on the results of this survey.
EXHIBIT 9: Hotel Development Costs as a Percentage of Total Costs
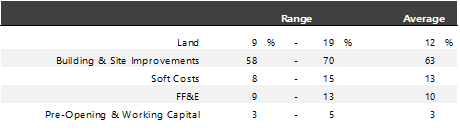
Source: HVS
Conclusion
The budgets analyzed in this survey are provided directly by the developers, owners, and lenders on both ground-up and conversion hotel projects during the course of an entire year. We believe the results of the survey provide a wealth of information, as the survey combines the data from actual construction budgets organized across ten product types. However, there are also limitations, as the results comprise unique hotel projects that cannot be replicated by the inherent nature of hotel development. A multitude of factors affect a hotel’s development budget. As such, we recommend that users of the HVS Hotel Development Cost Survey consider the per-room amount in the individual cost categories only as a general guide for that category. The averages in each cost category do not add up to the sum of the categories, as the total costs shown in the preceding tables are from per-room budgets for hotel developments and are not a sum of the individual components. Construction companies are the best sources for obtaining hard costs and FF&E costs for a specific hotel project. It is also advised that developers consult more than one source in their hotel development process to more accurately grasp the true costs of development. As always, HVS remains available to assist in this process.
All individual property information used by HVS for this cost survey was provided on a confidential basis and deemed reliable. Data from individual sources are not disclosed.
Other contributors:
Suzanne R. Mellen, MAI, CRE, FRICS, ISHC
Bomie Kim
Bomie Kim
Megan Thunem
Lizzette Casarin
Astrid Clough McDowell