One of the crown jewels of the Carolinas, Asheville is booming as a tourism destination. According to a recent study commissioned by the Asheville Convention and Visitors Bureau, some 9.1 million people traveled to Buncombe County in 2012, and a third stayed overnight—a strong indication of healthy hotel demand. These visitors spent $1.5 billion, generating $2.3 billion in economic impact and supporting 22,924 jobs1.
As Asheville’s allure has grown, so has its economic diversity. In the past decade, the city’s economic drivers have branched out into health care, advanced manufacturing, retail trade, and a wide variety of professional services. New Belgium opened their east coast brewery in 2016, just one of many new developments in another cottage industry in Asheville. Healthcare companies have been making major expansions, as well. The following In Focus report details factors relevant to the near-term vitality of Asheville’s hotel industry.
1 Economic Impact of Tourism. Asheville, NC Convention and Visitors Bureau. Retrieved March 5, 2015.
Hotel Market Performance and Forecast
Methodology
Average Occupancy and ADR are calculated from a selected sample of data in the HVS database. The data set is composed of occupancy and ADR from hotels located in corresponding MSA and hold at least 3-year of historical data in the company database. The data are directly obtained and corroborated through our primary local market research. With years of expertise and industry relationships in the local market, associates collect or estimate any missing occupancy and ADR information. Additionally, RevPAR is calculated by multiplying collected occupancy and ADR for each year. For this report, the data sample is comprised of 9 limited-service and 11 full-service hotels in the MSA.
The following charts illustrate trends in hotel supply, demand, occupancy, and average rate for Asheville hotels from 2013 through 2015, with forecasts through 2018.
Occupancy, Average Rate, and RevPAR to Drive Growth in the Near Term
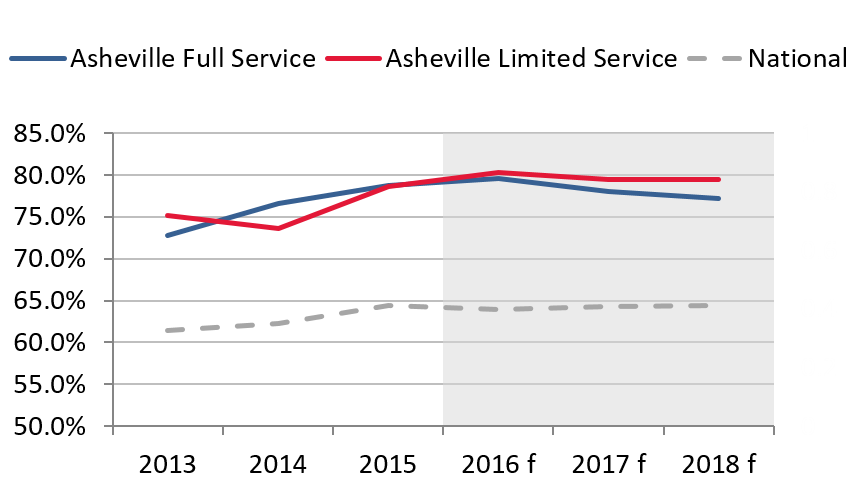
Asheville’s Occupancy Grew through 2015
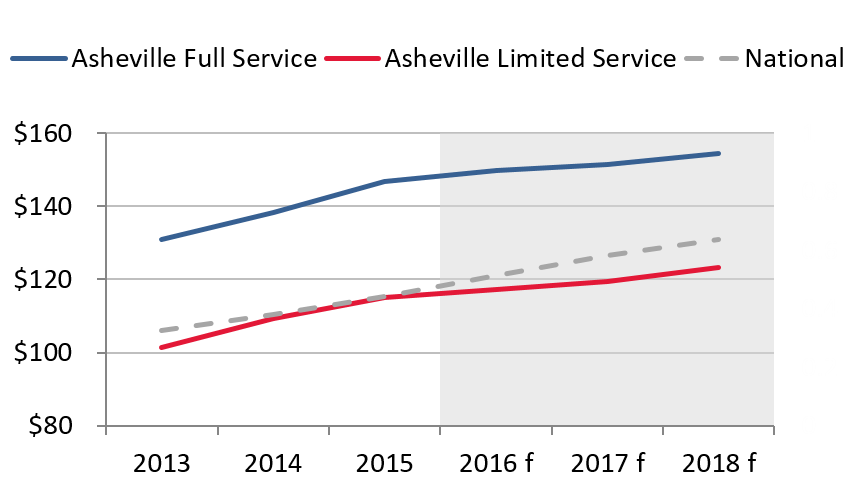
Asheville Outpaced National Average Rate
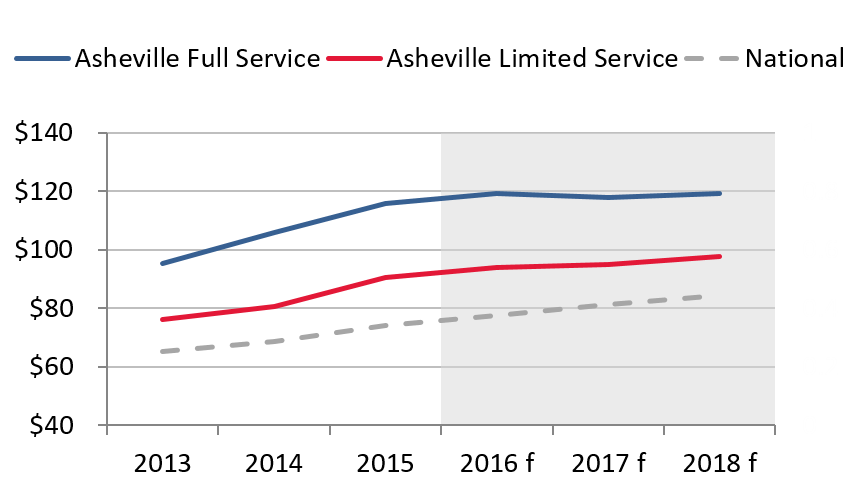
Asheville’s RevPAR Soars ahead of Nation
Source: HVS
Hotel supply in Asheville fluctuated only modestly in the middle of the past decade, before increasing in 2008/09, coinciding with the onset of the recession. Demand fell in 2007 and more significantly in 2008, though the decline tapered off in 2009. Nevertheless, given the increase in supply, overall occupancy in the market had trouble gaining ground. Consecutive years of economic growth in Asheville, along with rising tourism numbers and the absence of new supply, resulted in a market-wide occupancy upswing above 78% in 2015. Demand declines, the recession, and new supply converged to bring down average rates in Asheville in 2008/09; average rates had realized healthy growth since 2004, and rates have continued to rise in the years since their short-lived fall.
Asheville’s thriving economy, particularly its tourism element, has brought a rise in hotel demand, a trend HVS expects to continue in the near term. Historically, demand growth has outpaced new hotel supply in the market; in fact, occupancy in the market has increased in years of new supply (with the exception of 2009, at the height of the national recession).
Given the relatively large number of new rooms expected to enter Asheville in 2016 and 2017, HVS expects supply growth to initially outpace demand. Nevertheless, as the new hotels are promoted and become established, they are likely to help attract and accommodate more demand in the market. Demand should again outpace the expected supply increases in future years, which would result in record high occupancy levels.
Most of the new hotels are expected to command high average rates given their branding and scope of service. A market-wide rise in average rate is anticipated in 2016, though the increase is expected to be modest given the volume of new hotel openings in the market this year. As these hotels continue to ramp up toward stabilization, rate gains in line with historic averages for the market should return.
Existing Supply Breakdown
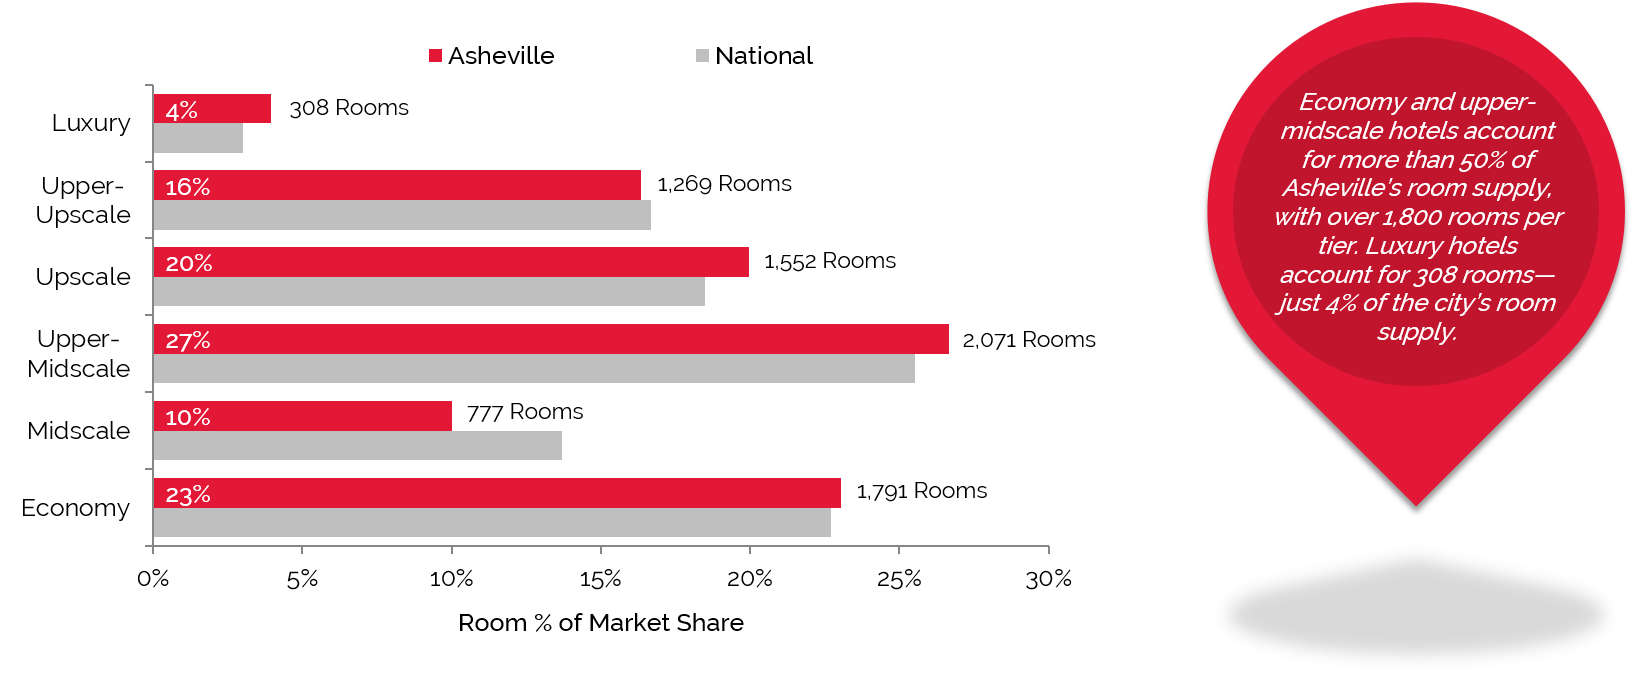
Asheville’s hotels are primarily clustered near Interstate 40 and Smoky Park Highway on the west side of the city, near the Asheville Outlets shopping mall, in and around Downtown Asheville, at Interstate 40 near the exit to the Biltmore Estate, near Asheville Mall and Tunnel Road on the east side of the city, and near the Asheville Regional Airport to the south. The city’s highest-performing hotels are those closest to the Biltmore Estate and Downtown Asheville.
Largest Portion of Rooms in Asheville & the Nation is Upper-Midscale Class
Source: HVS & STR
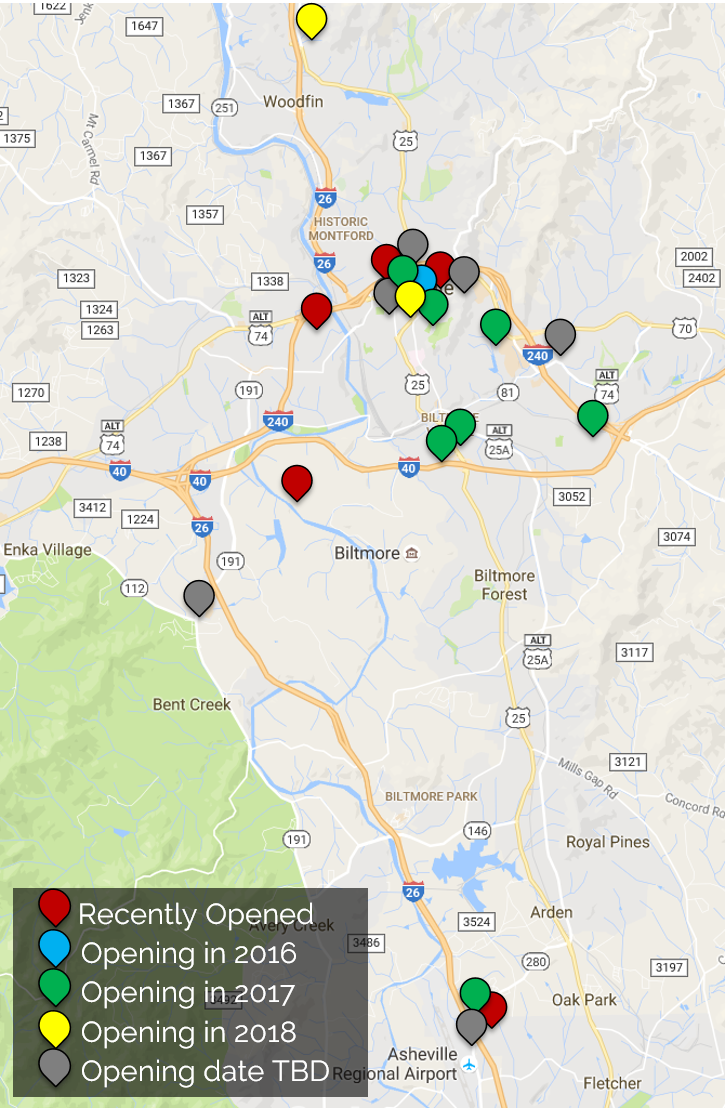
New Supply Pipeline
Majority of New Hotels are Expected in the Central Business District
Source: HVS, Buildcentral
If all of the listed hotels were constructed as planned, the new hotels would add over 1,900 new rooms to the existing supply of over 7,400 rooms in the city, representing an 20% increase in supply. Most hoteliers believe the new hotels will have a positive impact on the market. The product types vary from upper-midscale to upper-upscale and from extended-stay to luxury, providing a variety of options for different demand segments. Given Asheville’s economic expansion and its enduring status as a top destination for tourism, the increase in demand for hotel rooms should continue to grow.
The supply race in Asheville is gearing up, with many new hotels set to open in 2016 and 2017. Still, while market-wide occupancy levels may take a hit for approximately one year, demand from leisure and commercial segments is actually on track to offset the new rooms in the years beyond. Hence, given a swift absorption of the new supply, demand growth should scaffold occupancy in the market going forward.
Of the property classes and room counts that have been determined, the following chart illustrates the class breakdown of the new supply.
Asheville’s Upscale Hotel Room Inventory set to Increase by More Than 60%*†
Source: HVS,STR, and BuildCentral, Inc.
* Only includes properties with room counts and class designations
† Only the lowest value in the rooms range is considered
Hotel Value Trends
Asheville hotel demand has continued an upward swing in recent years. Rooms revenue increased by almost 17% in 2015, and leisure and hospitality employment grew by 6%. Air traffic to Asheville, another indicator of the city’s hotel demand, also rose by 4% last year. If, as expected, demand continues to rise, local hoteliers should be able to increase average rates, resulting in higher RevPAR. These positive market indicators have a bearing on hotel values in Asheville, which are anticipated to rise in the near term.
At the same time, high demand has brought more interest in hotel development, and room supply in Asheville is expected to grow substantially—particularly in the city’s downtown. Recent years have seen the closure of various aging hotels in the market, as well as the opening of the Windsor boutique hotel in 2014 and the Hyatt Place Downtown in 2016. The supply changes will make the hotel environment more competitive, though the exact impact on average rates and overall occupancy remains to be determined. HVS anticipates modest average rate growth in 2016, as the new supply will offer discounted rates initially and existing hotels may hold back on increasing rates in the near term. As the new hotels quickly ramp up, area hotels should be able to increase average rates in line with historical levels. It is important to note that existing hotels will need to maintain a quality product by completing regular maintenance and brand-mandated property improvement plans in order to stay competitive in the market. Those that do will win out by being able to command higher average rates while capturing increasing demand. This expected increase in average rate in the market, coupled with the anticipated increases in demand through 2019, should result in improving levels of revenue, which would in turn lead to higher hotel values.
Recent Hotel Transactions
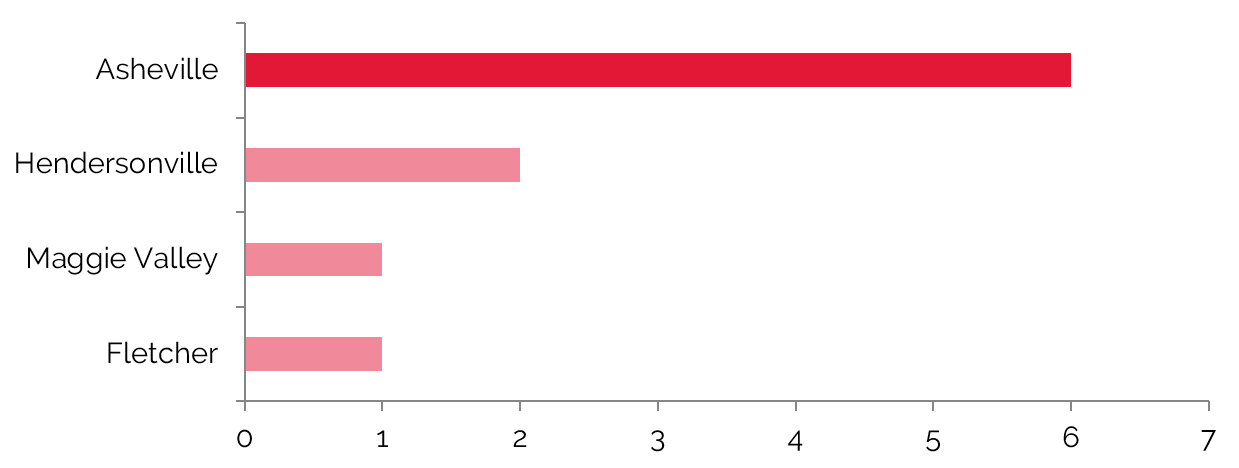
The following charts represent the hotel transactions in North Carolina from January 2013 through June 2016.
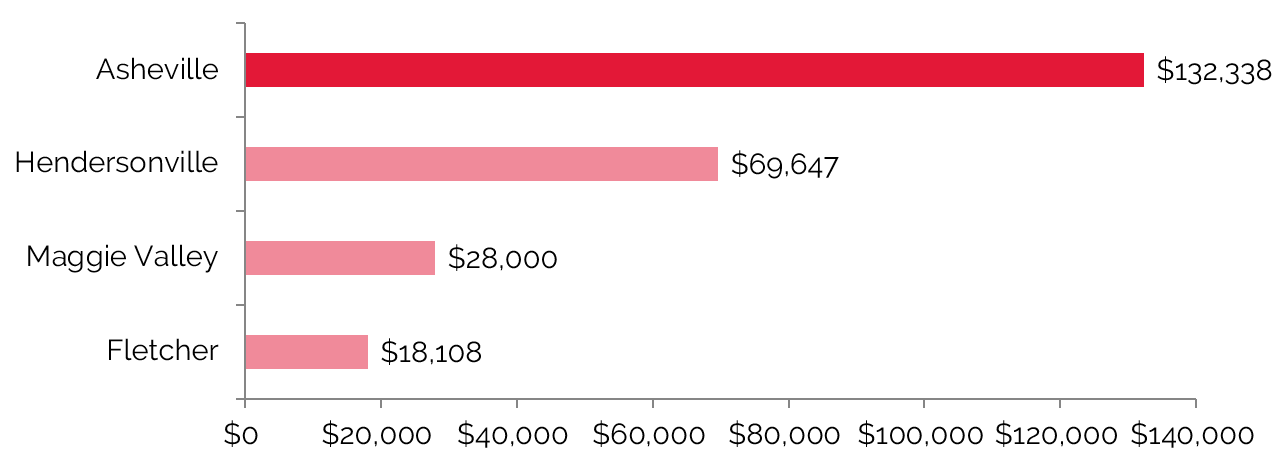
Asheville Records the Highest Number of Sales and Average Price per Room in the MSA
Number of Sales
Average Price per Room
Source: HVS & RCA
Hotel sales across Asheville MSA over the past three years have ranged from $304,348 per key down to $18,108, with pricing highly dependent on historical operations, location, product type, and if the property was under financial distress. In general, the better branded hotels in the state’s larger metropolitan cities have commanded the highest values on a per-room basis.
The historic Grove Park Inn and the Hotel Indigo were the only full-service Asheville-area hotel sales since 2013. The Grove Park Inn had been owned by the Sammons family since the mid-1900s and was sold to KSL Capital Partners in May of 2012. The property was then sold to Omni Hotels & Resorts in July of 2013; since the sale, Omni has invested approximately $25 million in property renovations and expansions. The Hotel Indigo sold in 2015 for $35,000,000, and included fractional ownership interest in several of the building’s condominium units. The new owners planned to invest approximately $400,000 in future renovations.
The remaining eight sales from 2013 through 2015 represented limited-service properties, with two of the hotels being independent of a franchise. The sales ranged from roughly $18,000 to $99,000 per key, averaging $59,000 for the eight sales.
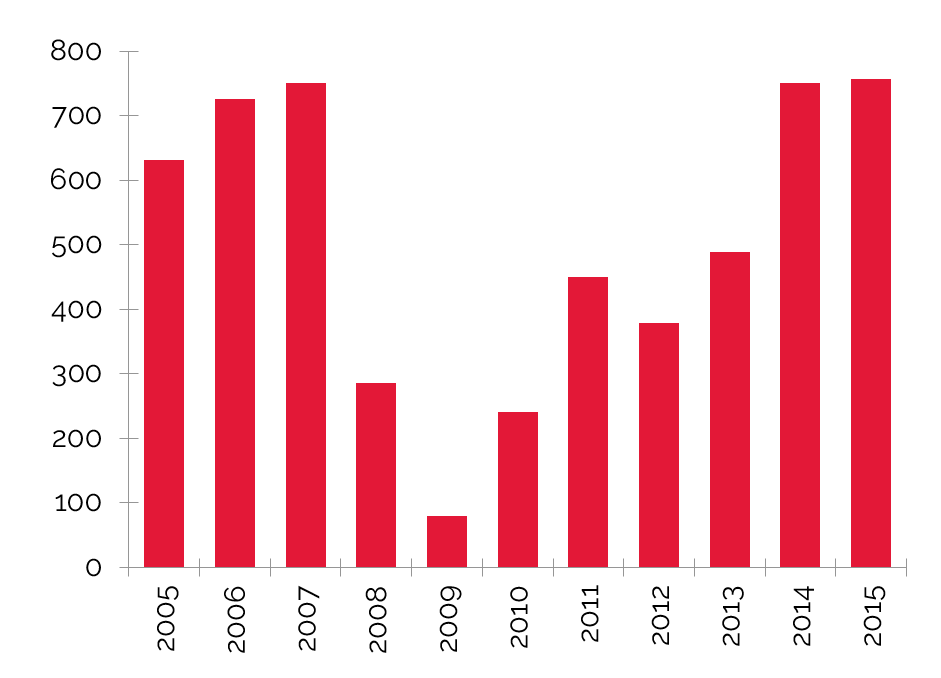
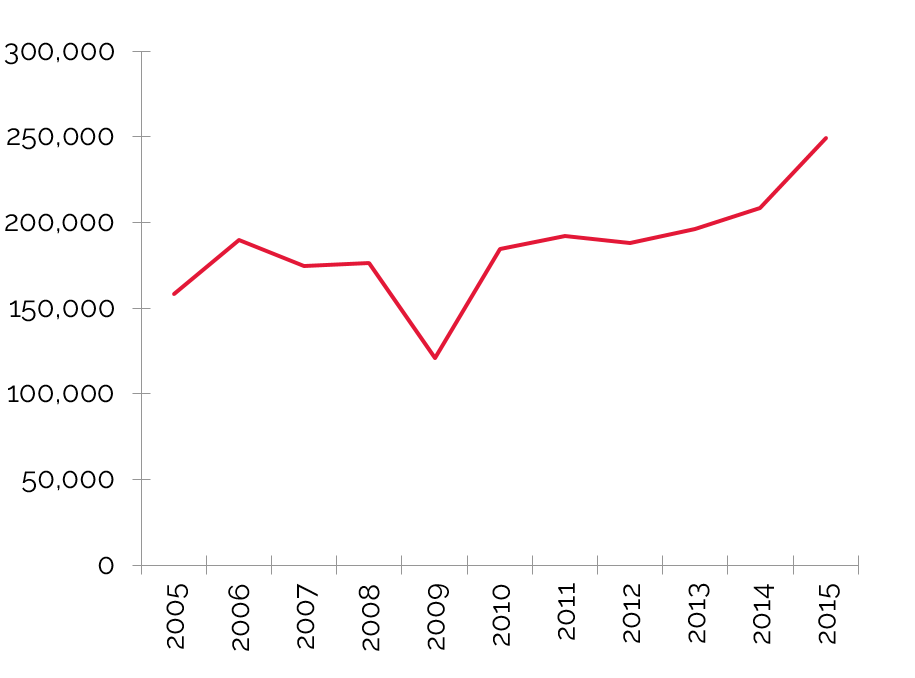
Across the nation, according to Real Capital Analytics, the lowest confirmed hotel sale for the preceding three years was the Hotel Seagate in the Toledo, Ohio CBD at $2,830 per key. The next two lowest sales occurred in Chicago and Atlanta. The highest confirmed sale, at $1.85 million per key, was the purchase of the Park Hyatt Hotel in the Manhattan Midtown West neighborhood. The next runner up was the Hollywood Saint Louis in Missouri at $1.22 million.
Number of Major U.S. Sales ($10 Million and above)
Average U.S. Key Price per Room
Source: RCA
Key Economic Indicators
Economic and Demographic Review
The adjacent charts reflect key economic data from Woods & Poole, Inc. on Asheville-Brevard’s combined statistical area (CSA), the Asheville metropolitan statistical area (MSA), Buncombe County, the state of North Carolina, and the nation.
In recent years, the average annual compounded growth rate of the resident population of Asheville’s MSA has been 5% higher than that of the nation. This small lead is expected to continue for the next five years. Conversely, the 2010–2015 average annual compounded growth rate of per-capita personal income for the MSA was about 30% lower than the nation’s, though the MSA’s growth rate is rising and anticipated to close that gap. Moving forward into 2020, the MSA should only trail the national average of 1.3% by about 10%. With a 0% growth pattern, the national wealth indexes remained flat from 2000 to 2015; these wealth indexes are projected to remain flat into 2020. The Asheville MSA, showing only nominal improvements, is moving slightly downward.
Asheville Population Growth Outpaces Nation
Population growth in the Asheville MSA registers 5% higher than that of the nation

Average annual compounded growth rate of per-capita personal income for the MSA was about 30% lower than that of the nation in the 2010—2015.

Source: Woods & Poole
Food and beverage sales in the Asheville MSA totaled $763 million in 2015, versus $682 million in 2010, reflecting a 2.3% average annual compounded change. Through 2020, the pace of growth is expected to moderate to 1.9%, equal to the national rate. The retail sales sector showed a 2.6% growth surge from 2010 to 2015, but like food and beverage sales, this is expected to level off to 2.0% through 2020, again equaling the national rate.
Radial Demographic Indicators
The following table reflects radial demographic trends for the Asheville market area measured by three points of distance from the center of Downtown Asheville.
Demographics by Radius from the Center of Town
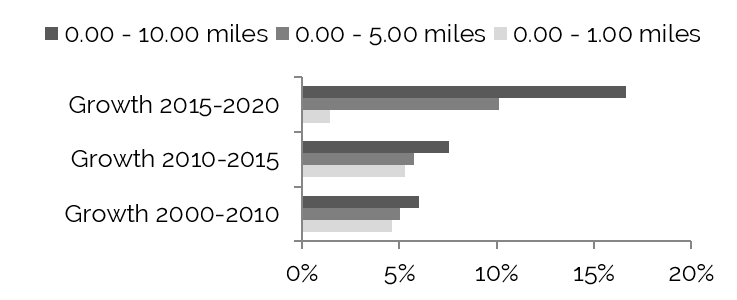
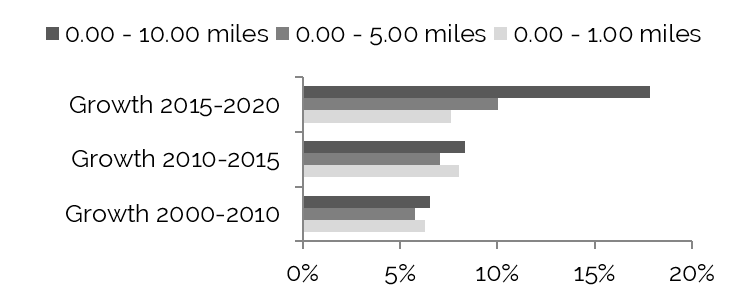
Population Growth to Increase within Ten-Mile Radius 2015–2020
Source: The Nielsen Company
Household Growth Most drastic within Ten-Mile Radius 2015–2020
Source: The Nielsen Company
Top Five Occupations – Estimated for 2015
Within One-Mile Radius

Within Five-Mile Radius

Within Ten-Mile Radius

Source: The Nielsen Company
Population growth within one mile from the center of downtown was limited from 2000 to 2010, whereas the greater area experienced signficant growth, over 16%, during this same period. Although the overall growth rate slowed significantly from 2010 to 2015, projected growth is anticipated to continue at about 5.0% per year. Households are expected to grow at a rate of 5.8% per year into 2021, as well.
2016 Forecast – Average and Median Household Income
Source: The Nielsen Company
Workforce Characteristics
The characteristics of an area’s workforce provide an indication of the type and amount of transient visitation likely to be generated by local businesses. Sectors such as finance, insurance, and real estate [FIRE]; wholesale trade; and services produce a considerable number of visitors who are not particularly rate-sensitive. The government sector often generates transient room nights, but per-diem reimbursement allowances often limit the accommodations selection to budget and mid-priced lodging facilities. Contributions from manufacturing, construction, transportation, communications, and public utilities [TCPU] employers can also be important, depending on the company type.
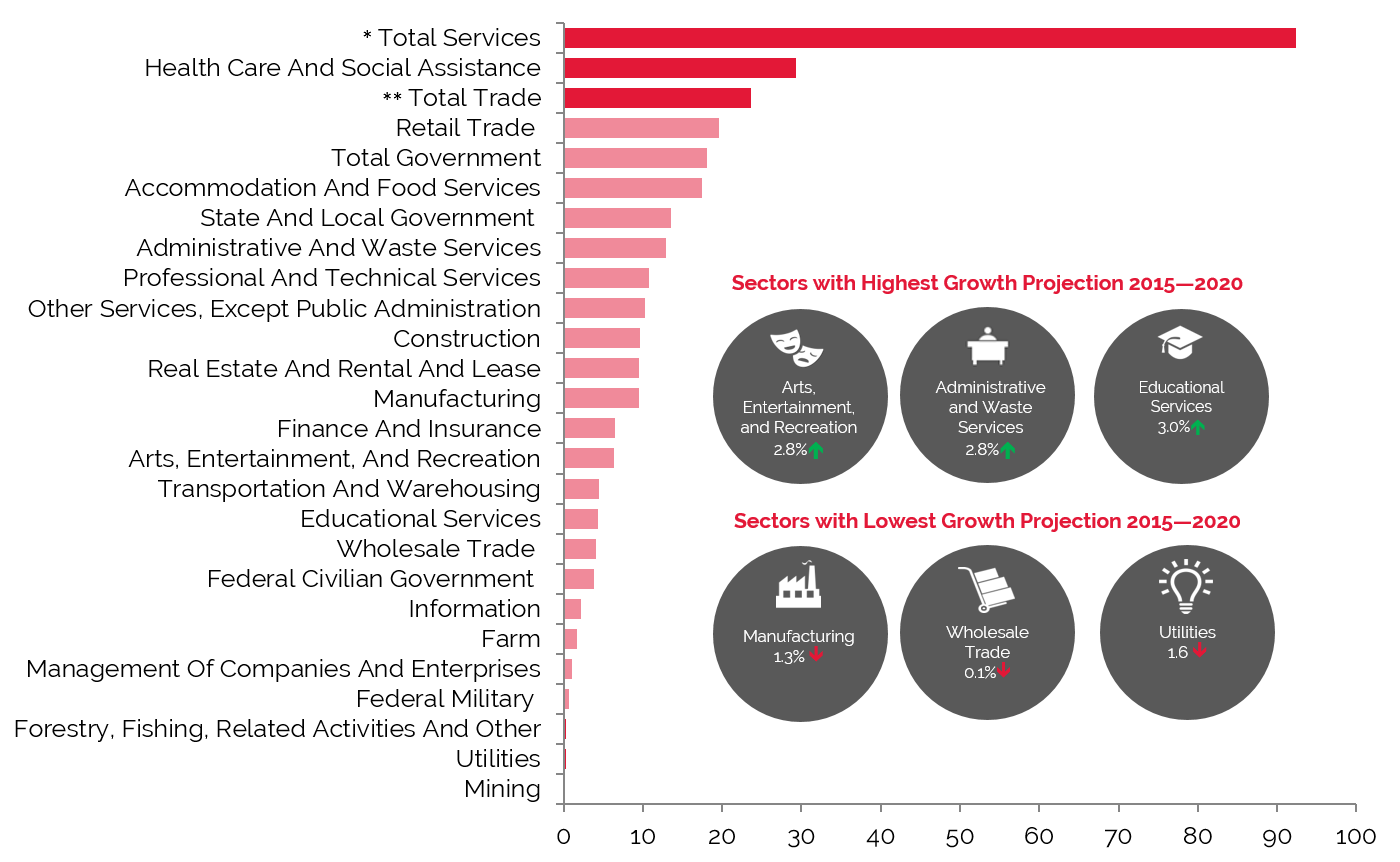
The following chart illustrates the three highest and lowest projected employment numbers by business sector in 2020 for the Asheville MSA’s workforce distribution.
Employment sectors belonging to Total Services and Total Trade (as detailed below) are anticipated to experience the most growth in Asheville’s MSA. Educational Services, Management of Companies and Enterprises, and Administrative and Waste Services are projected to achieve the highest rates of growth through 2020.
Utilities and manufacturing are expected to decline.
Employment Projections through 2020 Show Impressive Growth in Total Services
Source: Woods & Poole Economics, Inc.
* Total Services include: Professional and Technical Services; Management of Companies and Enterprises; Administrative and Waste Services; Educational Services; Healthcare and Social Assistance; Arts, Entertainment, and Recreation; Accommodation and Food Services; and Other Services, except Public Administration
** Total Trade includes Wholesale Trade and Retail Trade
Employment
As noted previously, local employment is largely centered on travel and tourism, healthcare, manufacturing, and retail. Total employment has increased at a greater pace than the change in population. For the Asheville market, of the roughly 184,000 persons employed in 2015, 26% are categorized as office employees, while 15% are categorized as industrial employees. Total employment increased by 2.9% from 2014 to 2015. By comparison, office employment expanded by 2.8% from 2014 to 2015. The number of households in this market in 2015 totaled 193,590, an increase of 1.8% from the level registered in 2014. Population expanded during this same time frame at a rate of 1.0%. Household average income grew by 2.2% in 2015, ending the year at roughly $88,538.
The following table illustrates historical employment, population, and income data for the overall Asheville market.
Historical Employment, Households, Population, and Household Income Statistics
Source: REIS Report, 2nd Quarter, 2016
Top Industries In Asheville
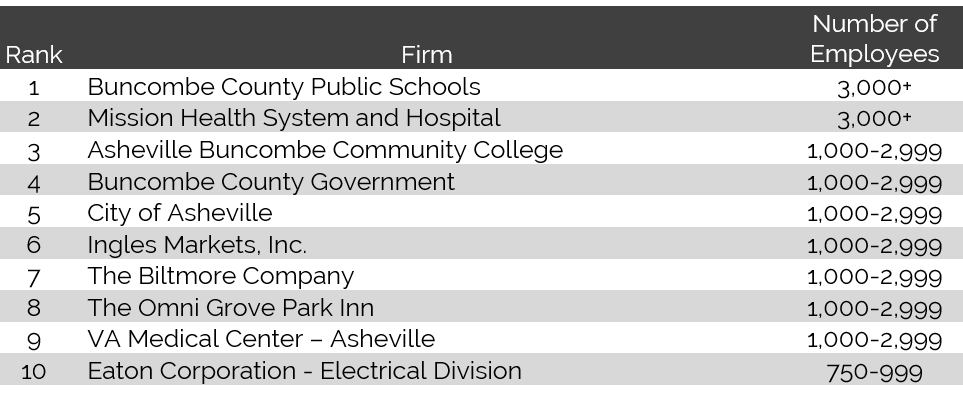
Top 10 Employers in Asheville by Number of Employees
Source: Asheville Area Chamber of Commerce, 2015
The Biltmore Company and the Omni Grove Park Inn highlight one of Asheville’s major economic drivers—tourism. Visitor spending in Buncombe County, an indicator of the health of the local leisure and hospitality industries, reached a high of $1.71 billion in 2014, an increase of 4.6% over 2013. The county's hotel tax revenue for the fiscal year ending June 2016 measured roughly $17.5 million, almost 50% over the original budget estimate. This increase was driven by an increase in the hotel occupancy tax rate, the commencement of Airbnb paying occupancy tax, and increase in the demand for county hotel rooms. Asheville was named to Frommer's list of "Best Places to Go in 2015" and to Travel + Leisure’s list of “The Best Cities in the U.S.” in 2016, distinctions that should help drive additional tourist and leisure travel to the area.
The health services industry is the largest employment sector in Asheville. An influx of baby-boomers and retirees in the area has made health care a major concern for local residents, and Asheville also draws visitors from the greater Western North Carolina area who rely on the city's specialized care facilities and technologies. Mission Health System generates approximately $963 million in economic activity for the Buncombe County and Madison County economies. The company’s expansions include the opening of an administrative office in Biltmore Park Town Square and the Mission Pardee Health Campus in 2013, as well as the Mission My Care Plus - Biltmore Park facility in 2014. Park Ridge Health also opened a new campus in southern Asheville in late 2014.
The area’s manufacturing industry has been transformed into a high-skilled advanced sector, with companies such as Eaton Corporation and BorgWarner representing some of the largest employers. In 2014, Linamar Corporation, a supplier of internal engine components, announced plans to add an additional 150 jobs and $115 million in new facilities and equipment over the next several years. In late 2014, GE Aviation celebrated the grand opening of its expanded production facilities in Asheville. The expansion will add 52 jobs by 2018 and represents a $126-million capital investment.
The brewing industry has been expanding in Asheville in recent years. Beer production in Asheville has grown from a handful of small microbreweries to numerous large-scale manufacturers. Oskar Blues opened in Brevard in 2012, and Sierra Nevada opened a brewery near the Asheville Regional Airport in 2013. New Belgium's East Coast brewery began brewing operations in Asheville's River Arts District in early 2016. The number of smaller breweries continues to increase as well, with Asheville's South Slope neighborhood just southwest of downtown becoming unofficially known as the city's Brewery District.
Unemployment
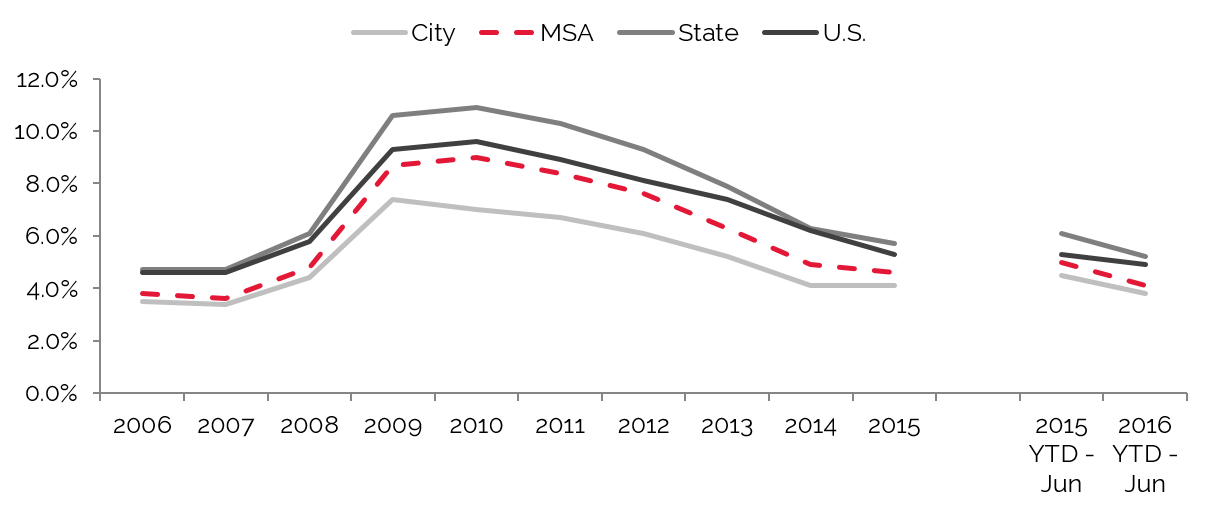
The adjacent chart details unemployment statistics in the city of Asheville since 2005.
Unemployment in Asheville has been on the decline since 2009, and employment remains strong within the healthcare sector and the manufacturing and tourism industries, including healthy employment levels at major employers such as Mission Health System, Eaton Corporation, and local hospitality and retail entities. The drop in unemployment in the latest comparable month of March is especially encouraging, edging out unemployment rates for the MSA, the state, and the nation.
Improving Unemployment Levels since 2009
Source: U.S. Bureau of Labor Statistics
Office Space
Trends in occupied office space are typically among the most reliable indicators of lodging demand, as firms that occupy office space often exhibit a strong propensity to attract commercial visitors. Thus, trends that cause changes in vacancy rates or in the amount of occupied office space may have a proportional impact on commercial lodging demand and a less direct effect on meeting demand. The following table details office space statistics in Asheville.
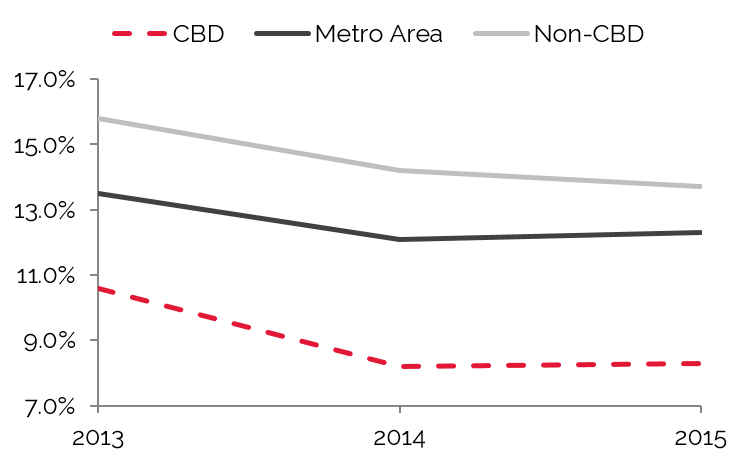
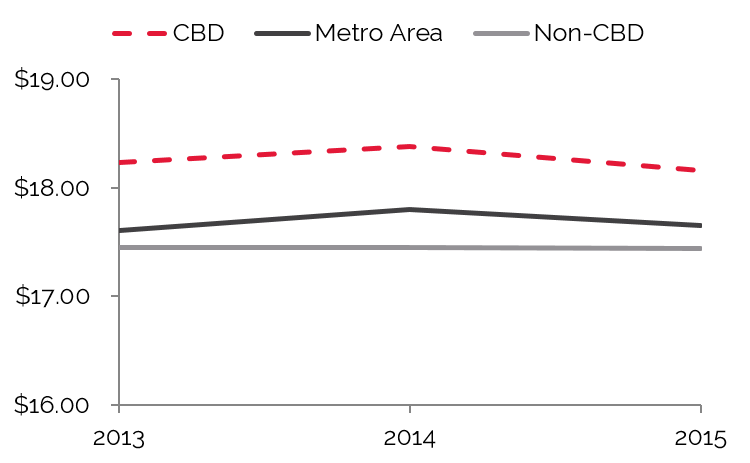
In the greater Asheville market, REIS reported a vacancy rate of 12.0% and an average asking rent of $17.80 for 2014. The CBD submarket's vacancy rate of 8.2% is below the overall market average, and the average asking lease rate of $18.38 is above the average for the broader market.
Asheville MSA Vacancy Rate
Asheville Asking Lease Rate
Source: REIS Report, 2nd Quarter, 2016
Convention Activity
A city’s convention activity helps gauge meeting and group visitation and demand for nearby hotels. Typically, hotels within three miles of a convention center benefit the most from this demand, and headquarter hotels can command premium rates. Very large conventions also drive demand to peripheral hotels, which can benefit from compression within the city as a whole.
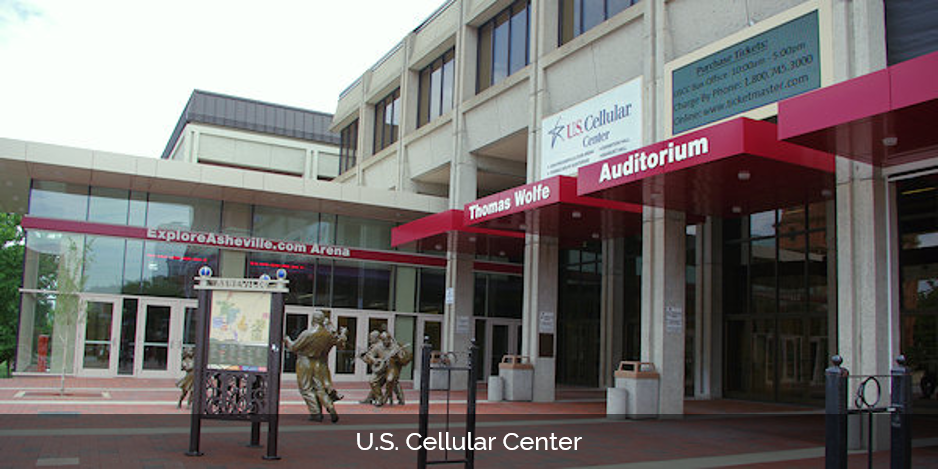
The U.S. Cellular Center Asheville comprises the Thomas Wolfe Auditorium, a 45,000-square-foot arena, a 25,148-square-foot exhibit hall, and a 5,159-square-foot banquet hall. The recently renovated facility remains one of the busiest civic centers in the region.
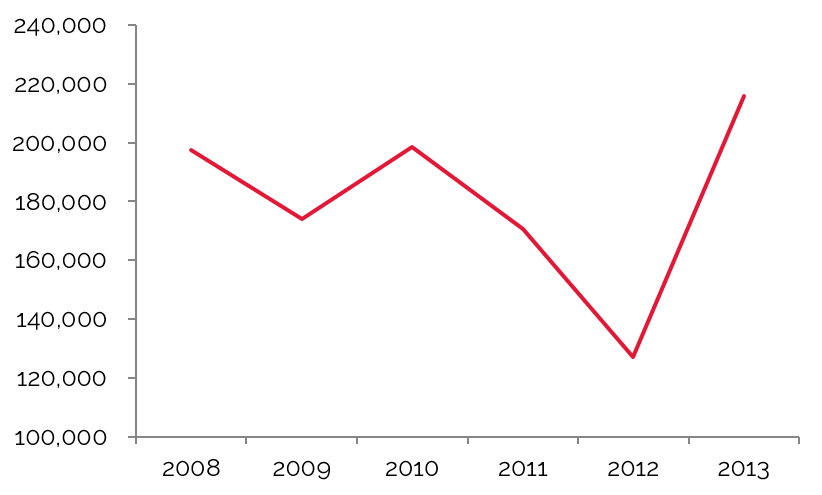
The graph to the right details convention statistics at the U.S. Cellular Center from 2007 through 2013. Nearly 216,000 delegates attended events at the U.S. Cellular Center in 2013, the last year for which data were available. This represents an enormous rise from the previous year, which had the lowest number of attendees since 2007. The center has more than a dozen events booked for 2015, ranging from author and spoken-word presentations to children’s events to pop and orchestral musical performances.
U.S. Cellular Center Breaks Attendance Record in 2013
Source: U.S. Cellular Center
Airport Traffic
Airport passenger counts are important indicators of lodging demand. Trends showing changes in passenger counts also reflect local business activity and the overall economic health of the area.
Asheville Regional Airport, located approximately 15 miles south of Downtown Asheville, serves the greater western North Carolina area with daily flights on Delta, Allegiant, United, and US Airways. The adjacent table illustrates recent operating statistics for the airport.
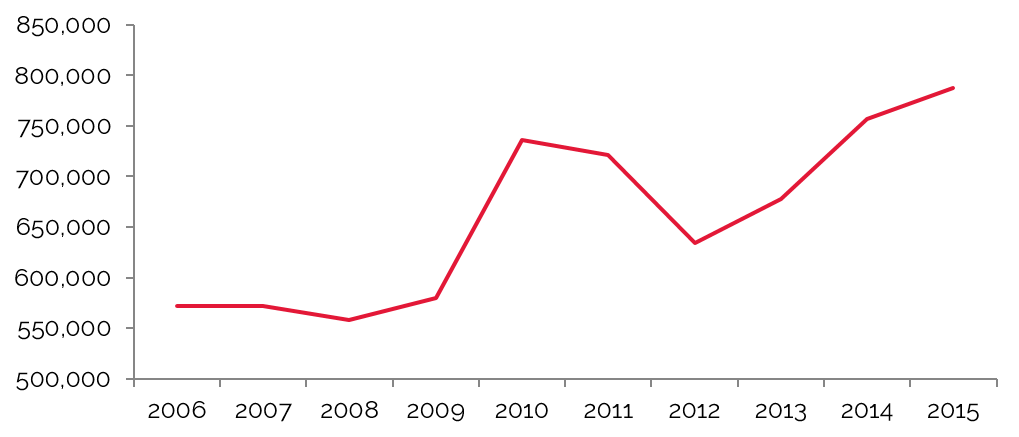
Passenger traffic through the airport rose 4.0% from 2014 to 2015; the average annual change during the prior decade was 2.4%. Several factors contributed to the major increase last year, including new routes and flights. Allegiant added two new nonstop flights to Florida in 2013, while other airlines increased the number of available seats on existing flights during the peak travel seasons. In addition, residents have chosen to fly local more often, rather than traveling through nearby Greenville or Charlotte.
Airport Passenger Traffic Peaks in 2015
Source: Asheville Regional Airport
Tourist Attractions
Many attractions support Asheville’s vibrant tourism industry, which has its peak season in April through December.
The Biltmore Estate, built more than a century ago by billionaire George Vanderbilt, originally served as the family's country retreat in North Carolina’s Blue Ridge Mountains. Today, the Biltmore House

remains the largest private home in the United States. A second hotel on the estate is expected to open by November of 2015.
Downtown Asheville houses more than 100 restaurants and a variety of local retail, gift, and specialty shops. Pack Square Park, which was completely revitalized in 2010, encompasses fountains, walkways, and terraces, as well as a natural amphitheater that hosts outdoor festivals and concerts throughout the year.
The Blue Ridge Parkway is the most visited unit in the National Park System. The recreational motor road was created as a link between the Shenandoah and Great Smoky Mountains National Parks. The Parkway extends through Asheville and provides access to outdoor activities such as hiking, mountain biking, canoeing, and camping.
Asheville's arts and crafts community is renowned worldwide. Downtown Asheville features several galleries that showcase the work of local artists. The Southern Highland Craft Guild, with two shops in Asheville, is one of the strongest craft organizations in the country, representing over 900 artists in nine southeastern states.
Closing Remarks
Asheville’s hotel performance since 2009 speaks volumes about the market’s ability to recover from economic adversity. Both occupancy and RevPAR have risen consistently in recent years, aided by the fact that supply has largely been kept in check. With strong fundamentals and increasing demand, especially in the form of tourism, developers have shown increased interest in bringing new supply to the market. Nevertheless, the upcoming projects, while posing a challenge in the near term, should positively influence the market in the long run, as existing hotels that have undergone renovations should be able to keep pace with average rates and occupancy penetration increases. Overall, prospects for Asheville’s hotel market remain promising.







 A city’s convention activity helps gauge meeting and group visitation and demand for nearby hotels. Typically, hotels within three miles of a convention center benefit the most from this demand, and headquarter hotels can command premium rates. Very large conventions also drive demand to peripheral hotels, which can benefit from compression within the city as a whole.
 remains the largest private home in the United States. A second hotel on the estate is expected to open by November of 2015.