The hotel market has experienced challenging times throughout the past 12 to 18 months as wide bid-ask spreads, sharply declining RevPAR and lack of new debt have shut down the transaction market. Although a significant amount of equity is pent up on the sidelines, deals have come to a halt because investors are waiting for the market to bottom. But what if we’re at the bottom? What if the bottom will last for the next six to twelve months? When will it be clear that now is the right time to start investing?
The transaction market has clearly regained momentum in other sectors of the commercial real estate investment market, and we expect hotels to follow suit. To determine when investors should start acquiring properties, it is critical to first understand the impact of the past 12 to 18 months on the hotel investment market and then to take views on both RevPAR performance and the availability of debt in the near future.
It is our expectation that we are entering a major acquisition phase. Investors with long-term vision and experience in the market will be able to make strategic purchases that will yield significant returns over the long term.
What Has Happened Over the Past 12 to 18 Months?
- Hotel values have fallen drastically.
- The wide bid-ask spread has shut down the transaction market.
- Cap rates have increased and are close to peaking.
- Trading has deteriorated.
- Despite deteriorating trading, distressed asset sales have not materialised.
Hotel Values Have Fallen Drastically
The key reasons for the fall in values over the past year include deteriorating trading performance, an increase in the cost of capital (despite drastic rate cuts, spreads are close to historic peaks) and an increase in yields by approximately 100 to 150 basis points.
Europe
In 2008, values for four and five star hotels in Europe have declined by an average of 10.8%, according to HVS’s European Hotel Valuation Index. Values fell by an average of 8.4% in Western Europe, 9.4% in Northern Europe, 10.1% in Southern Europe and 15.7% in Eastern Europe. Values have continued to fall through 2009, and we project that by year end values will be down an average of 20%.
United States
In 2008, values for a typical hotel in the United States have declined by an average of 14.7%, according to HVS’s Hotel Valuation Index. Values for gateway cities fell by an average of 8.8% in New York City, 12.0% in Los Angeles, 11.9% in Miami, 19.9% in Chicago and 6.9% in Washington DC. Values have continued to fall through 2009, and HVS projects that by year end values will be down an average of 30%.
The Wide Bid-Ask Spread Has Shut Down the Transaction Market
The transaction market has shut down because buyers will not pay yesterday’s prices when values have evidently decreased due to higher costs of capital and deteriorating net operating income. More hotels will transact when sellers realize they cannot value hotels off of historic earnings and when buyers believe RevPAR declines have reached the floor.
Cap Rates Have Increased and Are Close to Peaking
Hotel cap rates increased significantly from the beginning of the recession up until, and slightly after, the time that net operating income began to decline. This happened because values decreased, attributed to lower leverage and higher costs of capital, while net operating income was maintained. Now that net operating income has been declining, cap rates are increasing at a slower pace, signaling that cap rates could be approaching their peak.
The below chart illustrates commercial yields for the European Union from 1992 to 2008 and a comparison to government bond yields during the same period.
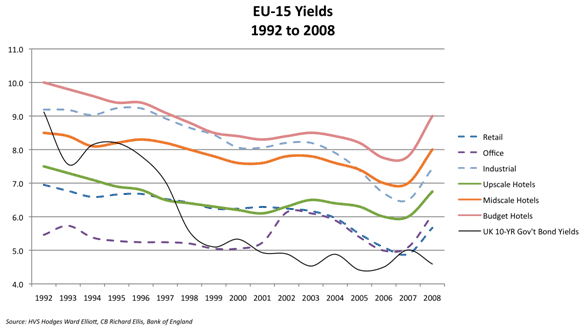
Compared to the last cycle, where cap rates hit a low in 2007, hotels at current yields present a more attractive buying opportunity than at anytime during the most recent cycle.
Trading Has Deteriorated
Trading has continued to deteriorate through July 2009 due to lack of demand and reduced rates. To illustrate the severity of RevPAR declines, below is the most recent performance for gateway cities in Europe and the United States.
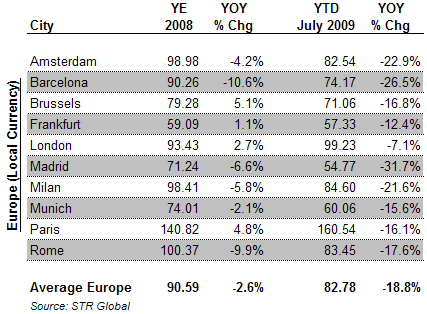
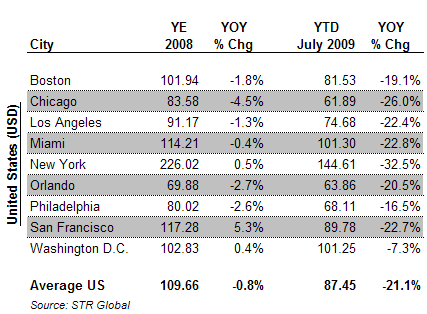
For the above cities in Europe and the United States, average 2008 RevPAR declined 2.6% and 0.8%, respectively, over the same period last year. RevPAR declined 18.8% in Europe and 21.1% in the United States through July 2009, over the same period last year.
Despite Deteriorating Trading, Distressed Asset Sales Have Not Materialised
The following are a couple triggers of a distressed asset sale - a sale in which the seller is forced to sell at a sharp discount due to negative market or financial conditions:
- Maturing loans cannot be refinanced.
- Owners are in breach of material financial covenants.
Distressed assets should create attractive acquisition opportunities in the future and force a price adjustment, but they have not materialized as quickly as cash-rich buyers have hoped. Although the United States saw the value of hotel properties in default or foreclosure almost double from $9 billion in Q1 2009 to $17.3 billion in Q2 2009, the large majority of these assets are the Extended Stay Hotel portfolio, Red Roof Inns and Homestead Studio Suites. For the most part, distressed full service assets in the Top-25 Metropolitan Statistical Areas are still not on the market. To date, the European market has seen very little in the way of distressed asset sales.
Although certain banks have significant exposure to the hotel sector, they have not been willing to foreclose on hotels, at this point in time, unless they have lost complete confidence in the owner and operations. We expect foreclosures to increase but many lenders to hold the assets on their books.
What Will Happen in the Near Future?
- RevPAR will stabilise in 2009 - demand, supply and RevPAR outlook.
- Debt markets will continue to improve.
RevPAR Will Stabilise in 2009 - Demand, Supply and RevPAR Outlook
Understanding the macro factors that drive the hotel market is essential to making intelligent investment decisions. Below are demand, supply and RevPAR trends and projections for Europe and the United States.
Europe - Demand Trends
GDP growth has historically been a good indicator for hotel demand. Looking back on previous cycles, it is evident that the cycles in hotel demand are closely correlated to the cycles in GDP growth. Below, we use forecasted GDP growth from the International Monetary Fund to estimate future hotel demand growth.
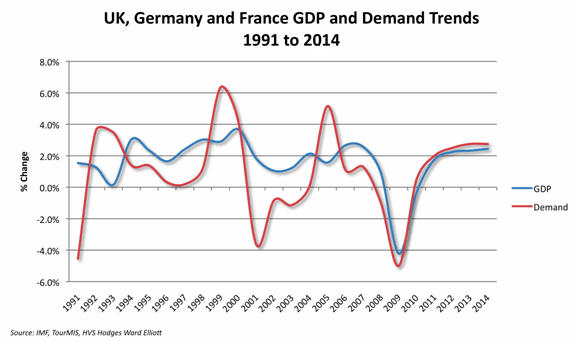
It is important to note that the downturn in 2001 was related to travel; people simply did not want to fly. However, the downturn in 2008 is a true economic downturn that is having a profound effect on the entire economy.
Europe - Supply Trends
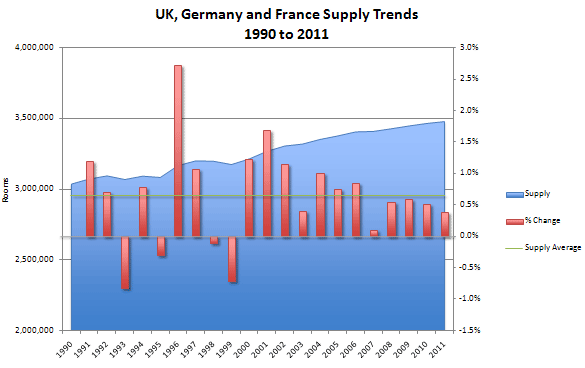
Over the past 18 years in the UK, France and Germany, the long-term average of supply growth is only 0.7%. Europe has much higher barriers to entry than the US, which is evident in the long-term averages. Looking at historic and forecasted data, annual supply growth for these three countries, which are representative of the Western Europe hotel market, will be under the long-term average for six out of nine years (2003 to 2011).
Source: TourMIS, Otus and Company, Lodging Econometrics, HVS Hodges Ward Elliott
Europe - RevPAR Outlook for Gateway Cities
We believe that the rate of RevPAR decline has hit the floor and will stay at current levels throughout the summer. We expect RevPAR, for the gateway cities we sampled earlier, to improve at the tail end of the year as comparisons are made to the weak fourth quarter of 2008. We anticipate RevPAR to be down approximately 15% to 18% at year-end 2009. Average rates should decline further in 2010 as the corporate segment drives hard rate negotiations, but we expect this to be balanced by improved occupancy driven by pent up travel demand and limited new room supply. We predict that RevPAR will be approximately flat in 2010 and positive in 2011.
United States - Demand Trends
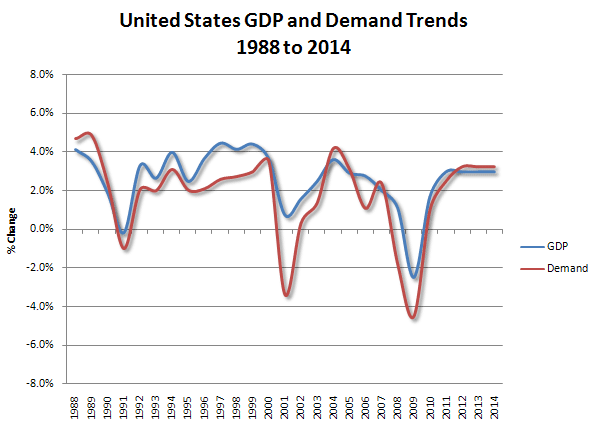
GDP growth is an even better indicator for hotel demand growth in the US than in Europe. Besides the disparity in 2001, which illustrates the difference between a travel-related downturn and a general economic downturn, the trend lines have been closely correlated throughout past cycles. Below, we use forecasted GDP growth from Bloomberg to estimate future hotel demand growth.
Source: IMF, STR, HVS Hodges Ward Elliott
United States - Supply Trends
Over the past 20 years in the US, the long-term average of annual growth in hotel supply has been 2.1%. Looking at historic and forecasted data reported by STR, the US supply growth will be under the historic average for 9 out of 11 years (2002 to 2012, and most likely through 2015). The two exceptions are
2008 and 2009; however, STR reported that rooms in the 2009 total active US development pipeline were down 22% in May, 25% in June and 26% in July, compared to the same periods last year.
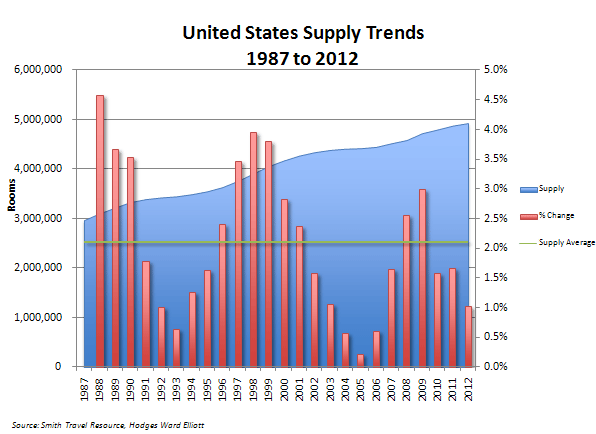
Limited room supply, which was not evident prior to the downturns of previous cycles, is an incredibly strong market fundamental that indicates the recovery from this cycle will be far greater than the recovery of previous cycles (following the downturn of 2001, US RevPAR grew by a significant rate of 7.5% annually from 2002 to 2007).
United States – RevPAR Outlook for Gateway Cities
We expect that the rate of RevPAR declines are close to bottoming in the US and will begin to improve during the tail end of the year. We anticipate RevPAR, for the gateway cities we sampled earlier, to be down approximately 16% to 19% at year-end 2009 once we make comparisons to the weak fourth quarter of 2008. Similarly to Europe, we expect average rates to further decline in 2010 as the corporate segment drives hard rate negotiations, but we expect improved occupancy driven by pent up travel demand and limited new room supply, to counter these declines. We predict that RevPAR will be flat in 2010 and positive in 2011.
Debt Markets Will Continue to Improve
Some signs indicate that debt markets are beginning to thaw as government initiatives start to revive capital flow and restore confidence.
- Government owned banks in the UK are required to start lending in an effort to inject credit back into the economy. Royal Bank of Scotland, 70% government owned, is required to lend £25 billion by April 2010 and a similar sum in the next financial year, £9 billion of which will be mortgage lending. Lloyds Banking Group, 43% government-owned, is required to lend £14 billion by the end of 2010, £3 billion of which will be mortgage lending.
- Corporate bond sales in Europe surged to an all-time high of $1.1 trillion through July 2009, beating the previous record set for the full year of 2007.
- In early June, Deutsche Bank issued its inaugural €1 billion Pfandbrief, German covered bonds (covered bonds are similar to CMBS, but in the event of default, the investor has recourse on both the mortgage pool and the issuer). This issuance was five times oversubscribed, signalling that credit market liquidity is continuing to improve.
- The US government’s investment in asset-backed securities through the Term Asset-Backed Securities Loan Facility (TALF) has had a positive impact on reducing credit spreads for these securities. Since March 2009, the spread on AAA debt backed by commercial real estate over US Treasuries has plunged 720 basis points to 4.6%, according to Barclays Capital.
- In the US, commercial and multifamily loan originations increased in the second quarter compared to the first quarter, according to the Mortgage Bankers Association, with hotel loans seeing an increase of 230%.
These signs, among others, renew confidence and demonstrate that debt markets should continue to improve as the year progresses.
What Evidence Demonstrates That We Are Entering a Major Acquisition Period?
- Activity in commercial / residential sectors has increased.
- Investments in public hotel companies demonstrate renewed confidence.
- Transaction velocity trends indicate now is the right time to buy.
- IRR Analysis – If you buy today at a 7.5% cap rate, what returns can you expect?
Activity in Commercial / Residential Sectors Has Increased
The commercial and residential sectors typically lead the way and adjust quicker than the hotel sector. These sectors have regained some momentum, and we expect hotels to follow suit.
Commercial Deal Flow and Values Begin to Improve
The latest figures for London indicate that commercial property transactions are up in Q2 2009, the first increase in two years, signaling that the market may be recovering. Deal flow and values have begun to increase in traditional forms of commercial real estate for two main reasons:
- Certain sellers have reacted faster to the weaker market and have adjusted their price expectations downwards. With rents remaining fixed, as opposed to declining hotel EBITDA, yields have become relatively attractive. Yields at the top-end of the market have even hardened due to such intense competition for the few high-quality assets on the market.
- Financing is starting to become more available as banks are more willing to lend to traditional forms of commercial real estate due to lower perceived risk with fixed-income properties.
Positive Signs in the Housing Market
- US housing values rose in 18 of 20 cities in June, signaling that the market may be recovering.
- US single family housing starts, a strong indicator for the health of the housing industry, rose for a fifth month in July.
- US existing home sales climbed 7.2% in July, the largest monthly gain since 1999.
- US new home sales increased 11% in June, the largest gain in eight years and a further 9.6% in July, the largest gain in four years.
- Almost 60% of surveyors in the UK are reporting that the housing bid-ask spread is narrowing, according to RICS research.
- UK house values increased by 1.6% in July for the fourth month in a row.
- UK mortgage approvals reached a 17-month high in July. Approvals rose 7.4% compared to June and are 77% higher than a year ago.
Investments in Public Hotel Companies Demonstrate Renewed Confidence
The following investments demonstrate continued confidence in the public hotel sector:
- August 2009 - Initial Public Offerings are on the rise as investors are ready for brand-new stocks; Hyatt announced plans to raise $1 billion through an IPO, and Starwood Property Trust has successfully raised $952 million, making this the largest IPO of the year.
- July 2009 - Vector Group, a discount cigarette company partially owned by billionaire Carl Icahn, has bought 5.33 million shares of Strategic Hotels, giving them a stake of more than 7% in the company.
- May 2009 - Tata Group’s hospitality arm, Indian Hotels Company, has increased its stake in Orient-Express Hotels and Resorts to 9.7%, representing a purchase of a further 2.25 million shares.
- February 2009 - US property group, Colony Capital, and French investment group, Eurazeo, further increased their stake in Accor from 28% to just over 30%.
- January 2009 - Chicago billionaire, Sam Zell, increased his stake in Starwood Hotels & Resorts from 7.7% to 8.1%.
- January 2009 - A unit of Asian conglomerate Hong Leong has increased its stake to above the 3.0% disclosure level in InterContinental Hotels Group.
Additionally, US REIT’s have raised $14 billion in new debt and equity capital in 2009, according to Morgan Stanley, representing positive sentiment in the hotel market.
Transaction Velocity Trends Indicate Now is the Right Time to Buy
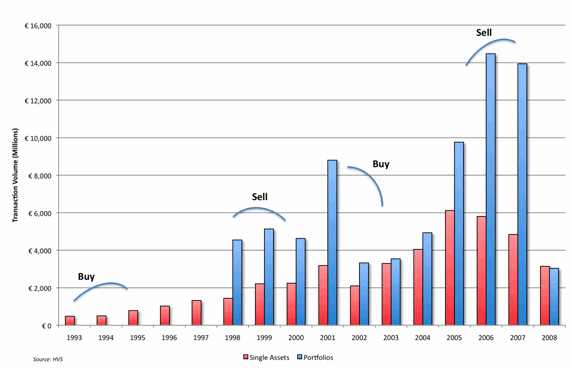
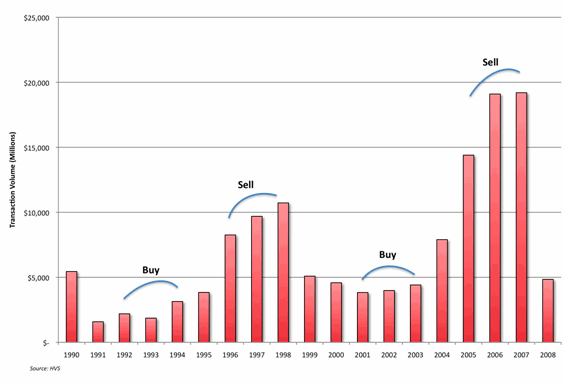
When analyzing past cycles of the hotel market, it becomes apparent that some years were clearly better to enter and exit the hotel market than others. In both Europe and the US, the best periods to enter and exit the market correlate with the peaks and troughs in the total amount of transaction volume. Additionally, the best times to buy have been during or following years of negative RevPAR growth.
Due to the fact that 2005 to 2007 were three years of unprecedented transaction volume and that we are currently in a year that will have negative RevPAR growth, 2009 and 2010 should be some of the best times to invest in the hotel market.
Europe
The most ideal times to invest in the European hotel market were from 1993 to 1995 and from 2001 to 2003. The most ideal times to exit the European hotel market were from 1998 to 2000 and from 2005 to 2007.
United States
The time periods are slightly earlier in the US, which is evidence that hotel trends begin in the US and then move to Europe. The most ideal times to invest in the US hotel market were from 1992 to 1994 and from 2001 to 2003. The most ideal times to exit the US hotel market were from 1996 to 1998 and 2005 to 2007.
IRR Analysis – If You Buy Today at a 7.5% Cap Rate, What Returns Can You Expect?
Buying a hotel at the low point of the cycle will yield high returns, as this is the beginning of the period where hotels will achieve the highest NOI CAGR. NOI CAGR was 13.5% in Europe and 17.9% in the US for a sample of hotels where we have data from 2001 to 2007 (trough to peak). We ran various scenarios to determine how sensitive unleveraged returns are to NOI CAGRs and terminal cap rates.

Assuming a 7.5% acquisition cap rate and a five-year hold period, an investor could realize a 15% unleveraged return with an NOI CAGR as low as 6%.
Conclusion
Towards the end of 2009 and 2010, we expect an upturn in transaction activity as operating markets stabilize, increased liquidity returns and prices reduce either as a consequence of owners needing to sell or banks foreclosing.
Those with long-term vision and experience in the market recognize that the industry is entering the first phase of an excellent opportunity for hotel acquisition and investment. Investors with access to deal flow, strong resources and sound partnerships with lenders will be able to take advantage of this stage of the real estate cycle and make strategic purchases that will yield significant returns over the long term.