INTRODUCTION
In 2025, the national lodging market has continued to demonstrate resilient performance, maintaining strong average daily rate (ADR) and revenue per available room (RevPAR) metrics despite flat occupancy growth. Compared to 2023 and 2024, ADR and RevPAR have remained near record levels, driven by solid group and business travel in primary markets, even as some leisure markets began to stabilize or soften. National occupancy remained unchanged from 2023, but overall hotel revenues have continued to grow modestly year over year. These trends suggest a market that has largely stabilized following the disruptions of the pandemic era. Nevertheless, the high cost of debt and capital, coupled with elevated construction costs, continues to weigh heavily on new hotel development activity. As a result, while the underlying performance environment remains favorable for development in theory, actual construction has been subdued, with the supply growth forecast for 2025 falling well below pre-pandemic averages.Although top-line hotel performance remains strong, developers continue to face barriers when it comes to bringing new projects to market. Elevated construction costs and expensive financing have slowed the number of new developments in the pipeline. Lenders remain cautious when it comes to new construction, often requiring more equity and applying conservative underwriting standards. As a result, while operational fundamentals support the case for new supply in some submarkets, broader development activity remains muted as stakeholders wait for greater economic and capital market clarity.
HVS has tracked hotel development costs for over four decades, collecting data from actual hotel cost budgets during our assignments. The 2025 survey reports per-room hotel development costs based on data compiled by HVS from hotel projects proposed or under construction during the 2024 calendar year. The data reflect six product categories: limited-service, midscale extended-stay, upscale extended-stay, select-service, full-service, and luxury hotels.
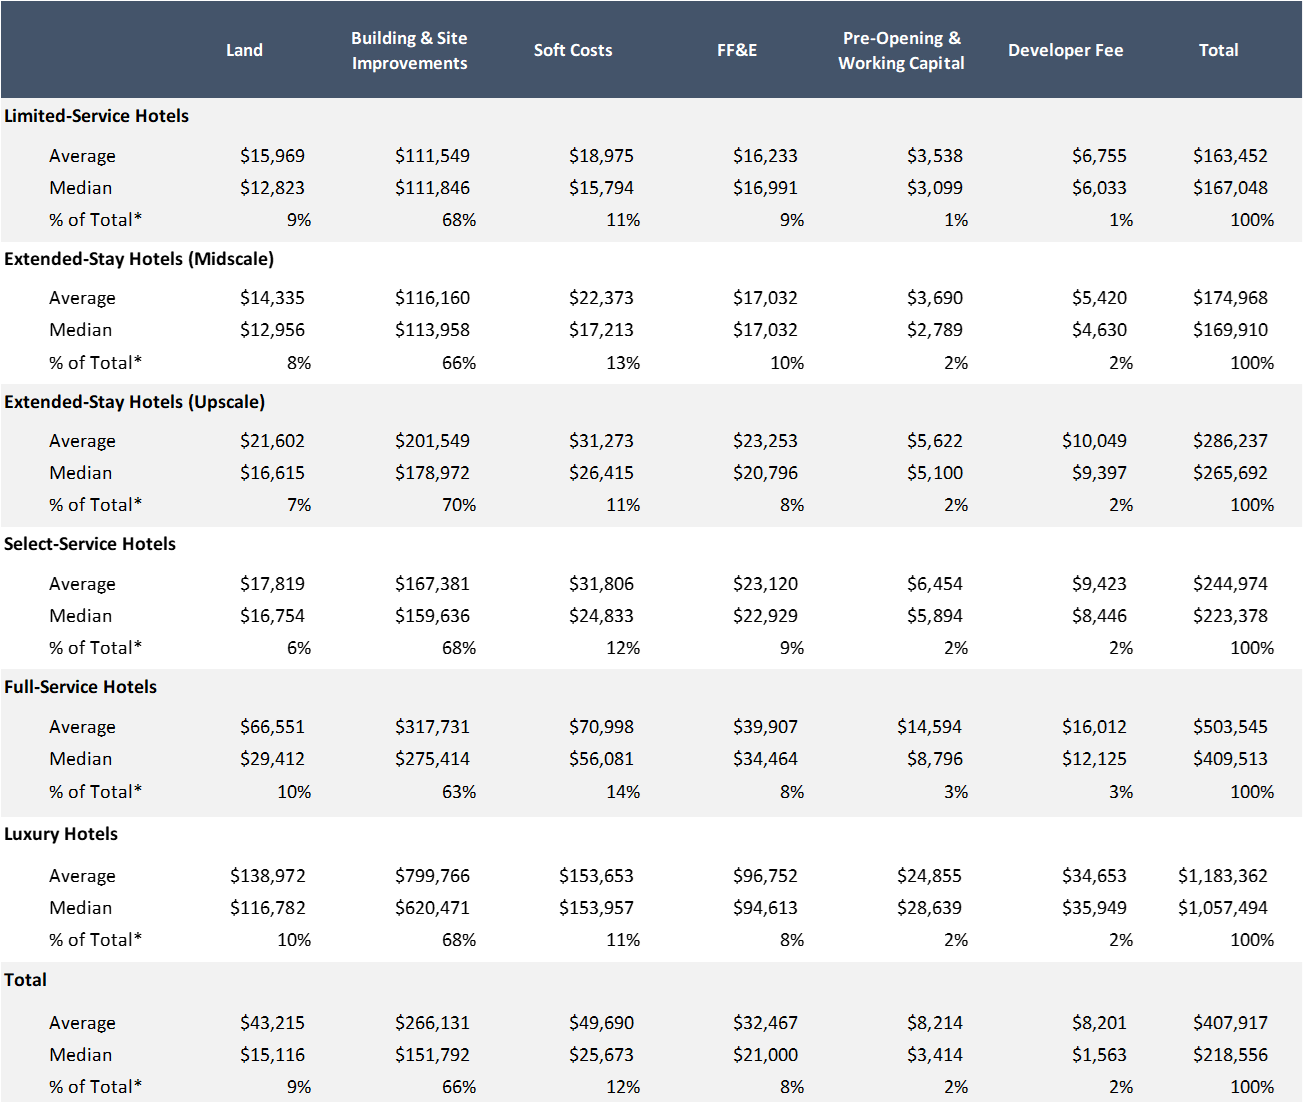
The HVS U.S. Hotel Development Cost Survey sets forth averages of development costs in each defined lodging product category. The survey is not meant to be a comparative tool to calculate year-to-year changes, but rather, it reflects the actual cost of building hotels across the United States in 2024. As will be discussed, the medians and averages set forth in this survey are greatly affected by the types and locations of hotels being developed at this point in the economic cycle. Our goal in sharing this publication is to provide a basis for developers, investors, consultants, and other market participants to evaluate hotel development projects. Given that development costs for hotels are dependent on a multitude of factors unique to each development and location, this report should not be relied upon to determine the cost of actual hotel projects or for valuation purposes. Instead, it is intended to provide support for preliminary cost estimates, as well as to show a comparison across the various hotel categories.
SUPPLY-AND-DEMAND DYNAMICS AFFECTING HOTEL DEVELOPMENT
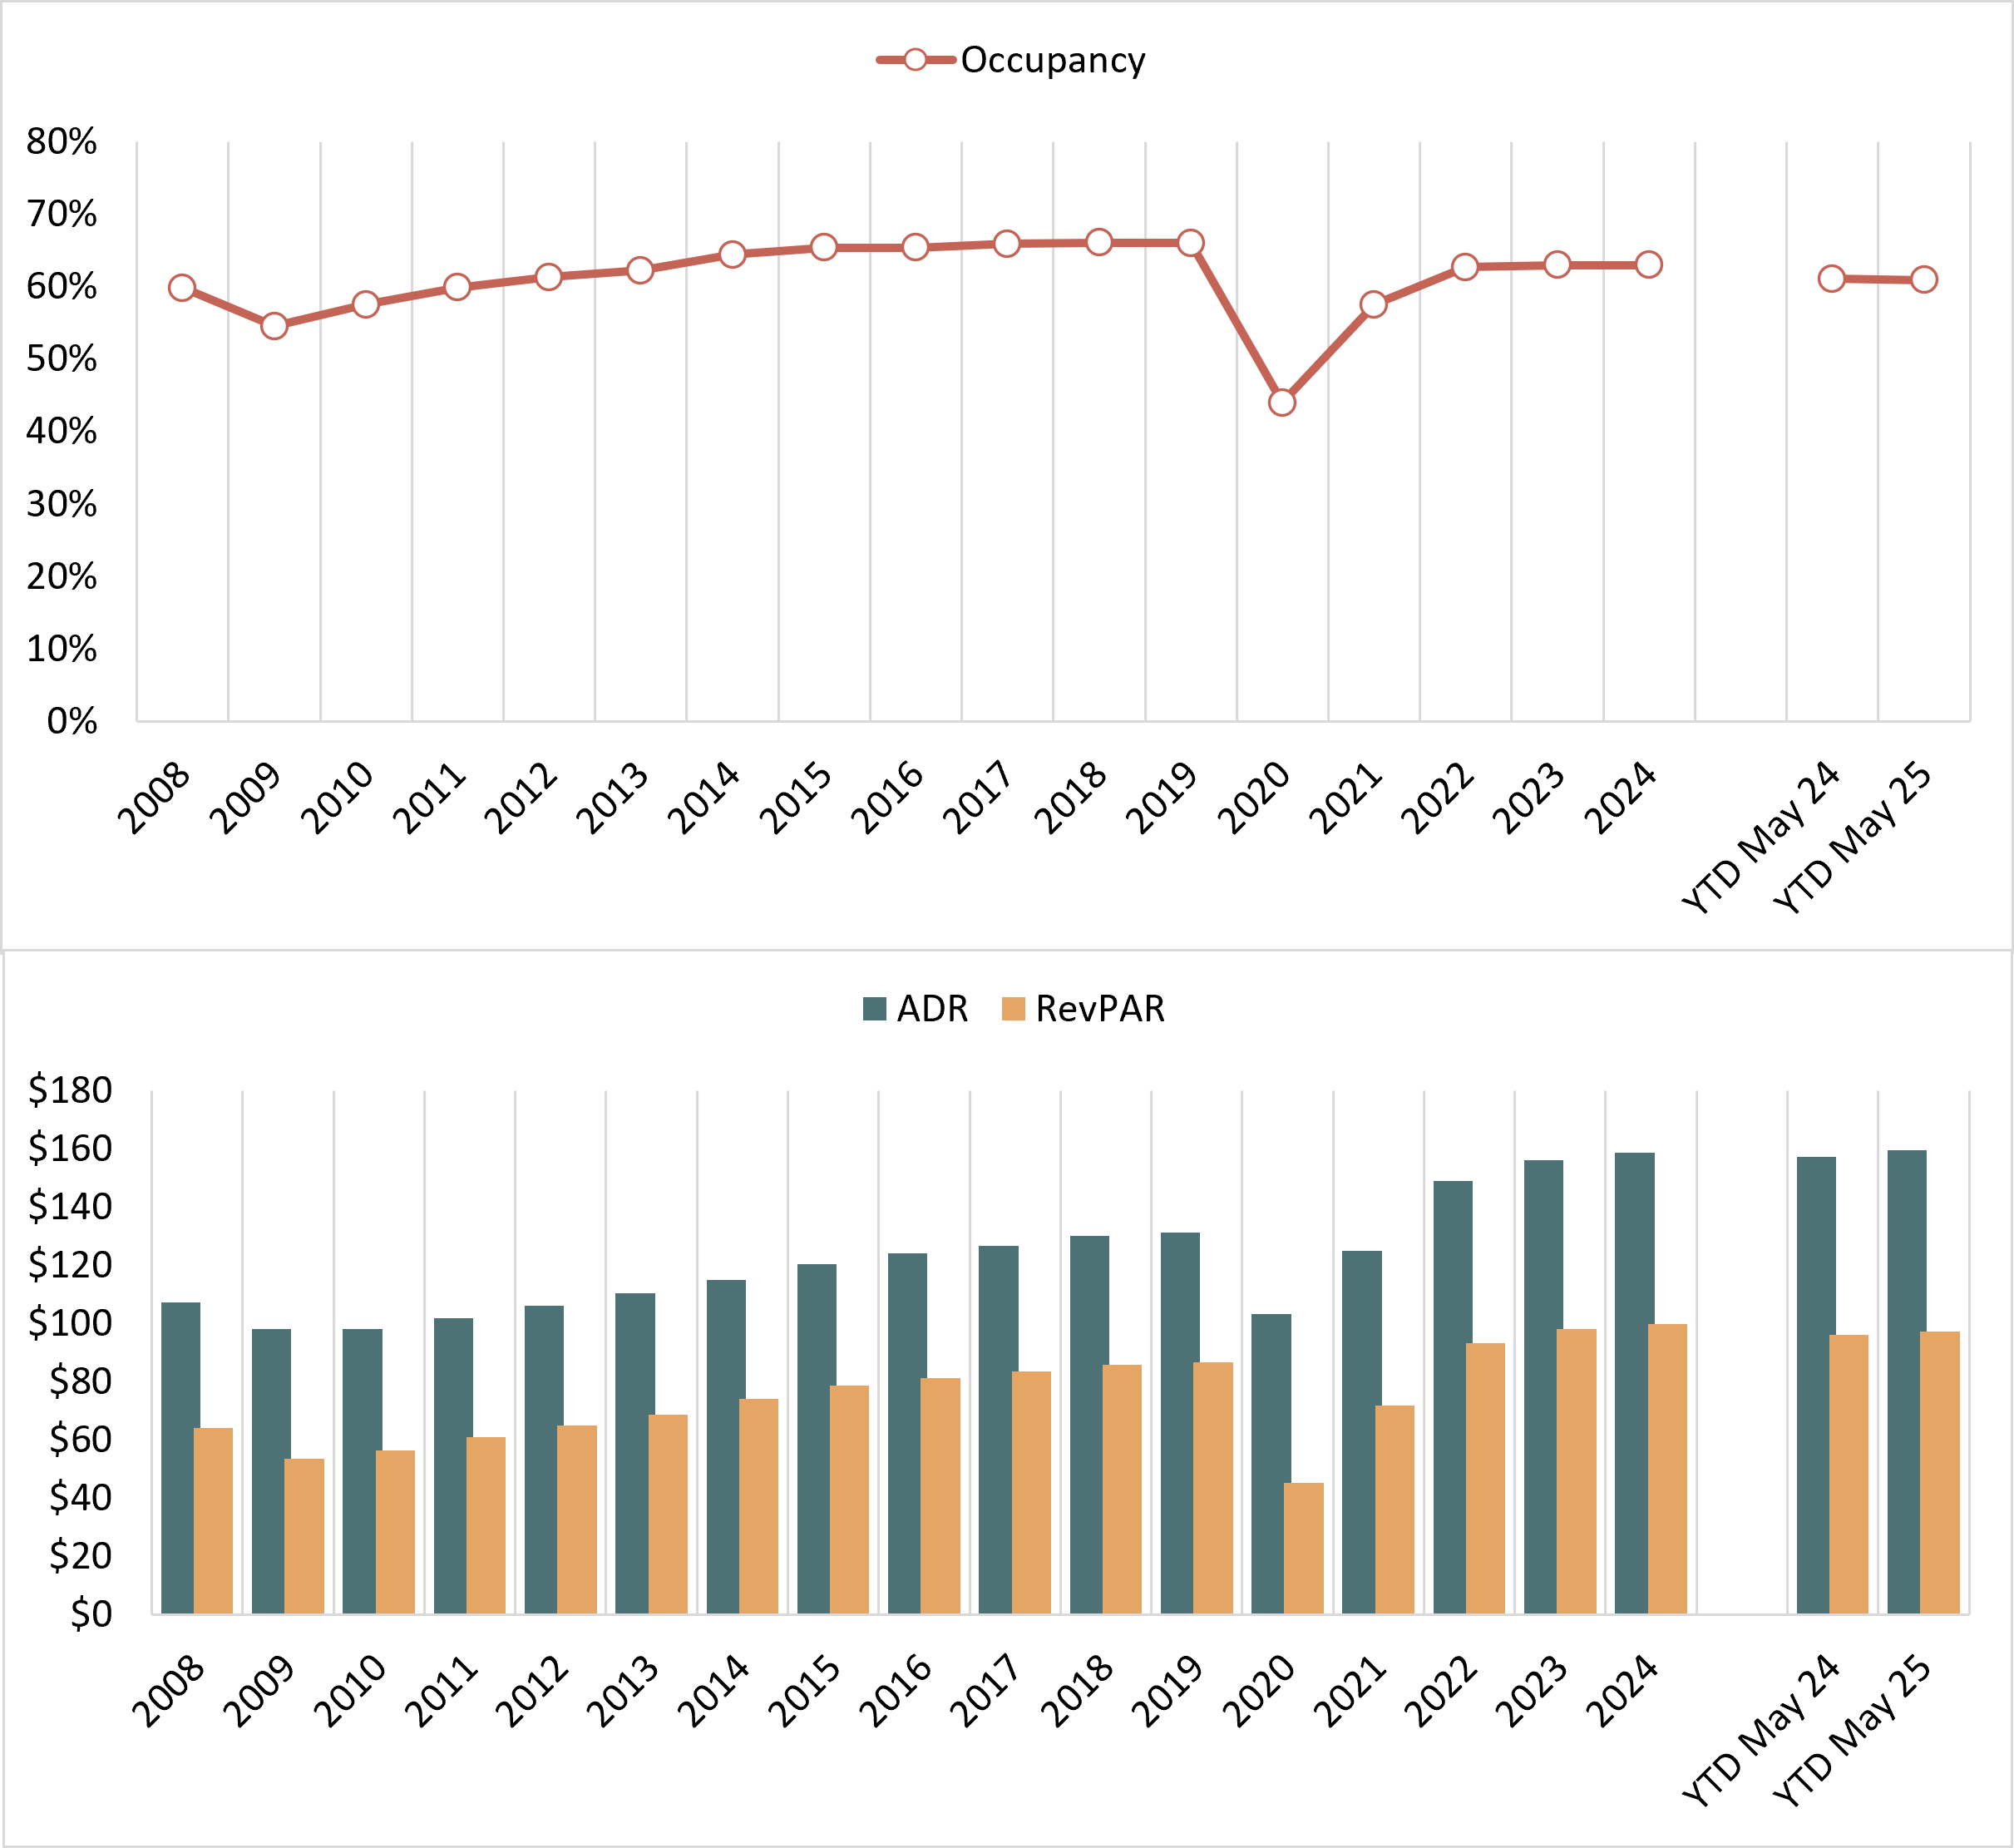
In 2024, U.S. hotel occupancy remained identical to the 2023 level, while ADR exceeded previous levels. STR reported national year-end 2023 occupancy at 63.0% and ADR at $158.67. In the year-to-date period through May 2025, the metrics were reported at 60.9% and $159.58, respectively, equating to a 0.4% decline in occupancy and a 1.6% increase in ADR when compared to the same period in 2024. Meanwhile, RevPAR was up 1.2% compared to the same period in 2024, illustrating a trend of slow but steady growth.EXHIBIT 1: U.S. ADR & REVPAR REACH ALL-TIME HIGHS IN RECENT YEARS, BUT OCCUPANCY STILL RECOVERING
 Source: STR

In 2024, the national market experienced a continuation of the dynamic from 2023 in which many leisure-oriented markets, which were the first to bounce back after the pandemic, underwent a correction, with some resort destinations showing flat or declining performance as the initial surge in demand tapered off. Urban destinations continued their recovery trajectory at a pace above the nationwide average. To further illustrate this point, primary markets, which comprise the top 25 cities in the United States, experienced a 2.7% increase in RevPAR in 2024 as compared to 2023; in contrast, all other markets experienced more modest RevPAR growth of 0.9%. This differential lessened in the year-to-date 2025 period, with 1.4% growth in RevPAR for primary markets compared to 1.1% growth for all other markets, indicating that the rebalancing or normalization of leisure vs. urban destinations may be complete.
At the same time, the broader lodging industry has navigated and continues to navigate a complex economic and political landscape. The uncertainty surrounding the 2024 U.S. election, elevated inflation (albeit at a slower pace than in prior years), and weak international visitation contributed to caution among both travelers and investors. By the first half of 2025, the market began adjusting to the new administration and its evolving policy direction. As with previous cycles, shifts in regulation, spending priorities, and macroeconomic sentiment can lead to changes in lodging demand, often in sectors or markets that had not previously been in focus. This underlying volatility continues to shape developer and investor expectations heading into the remainder of the year.
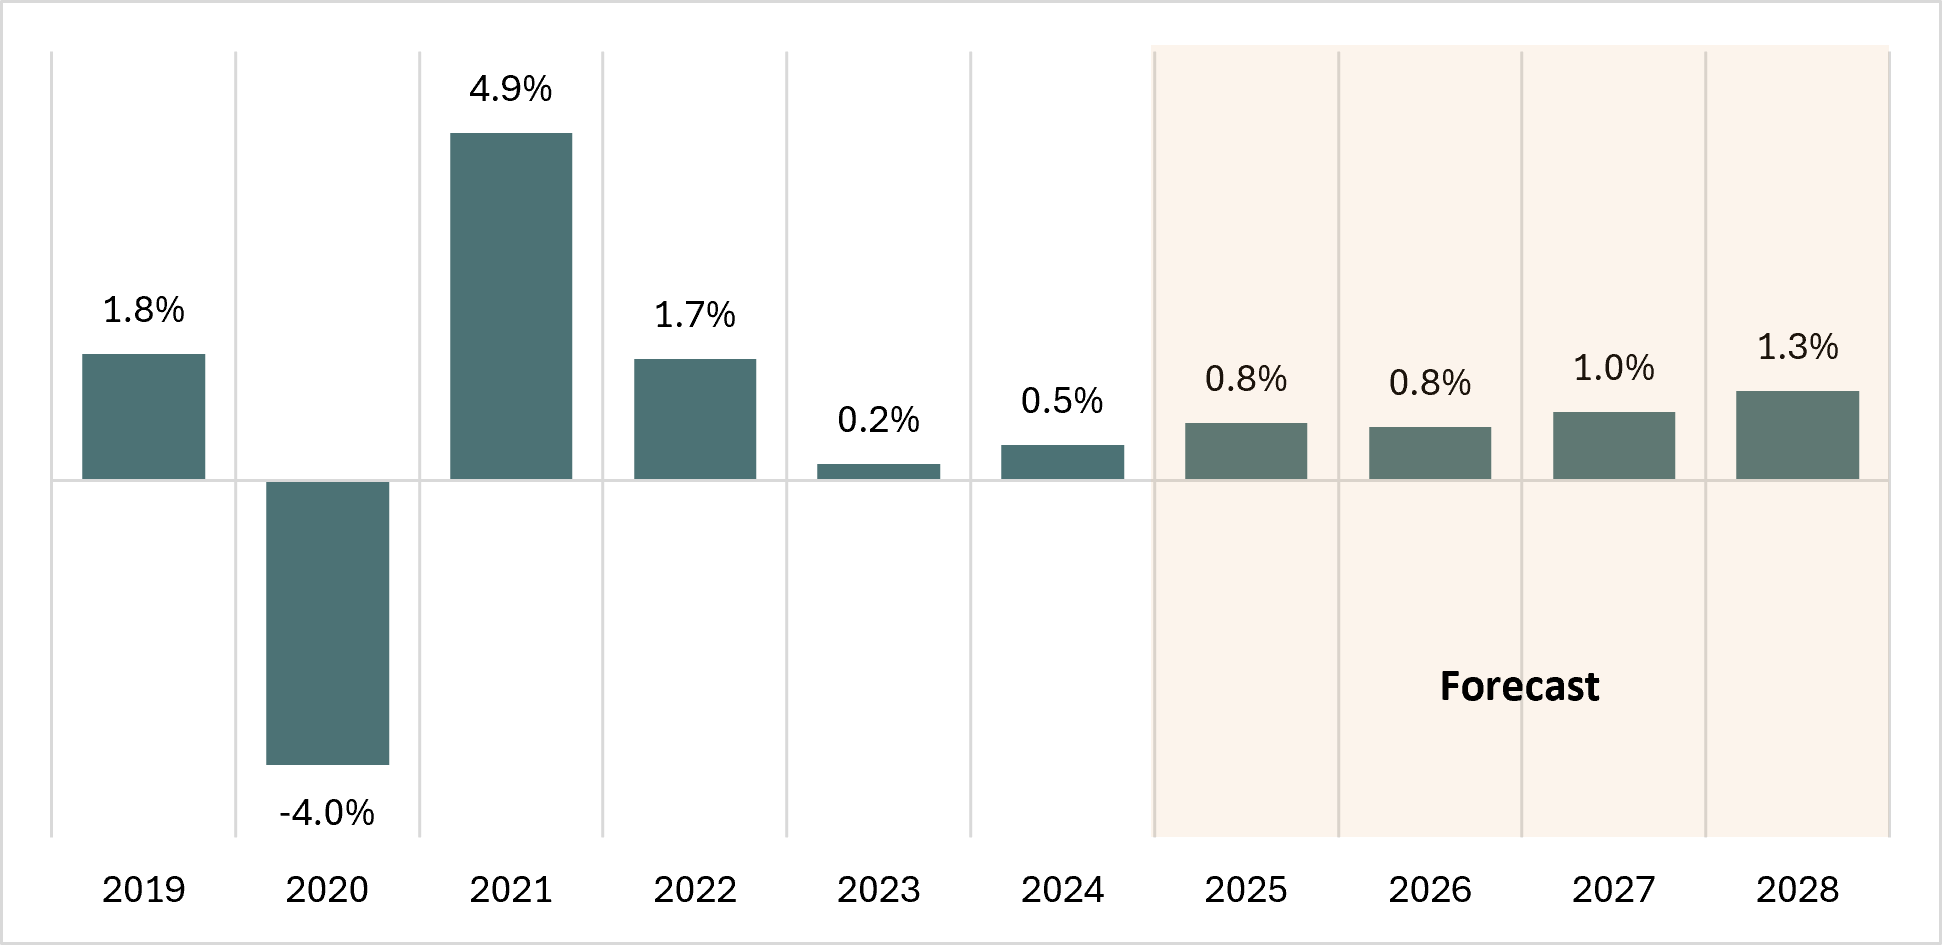
Supply growth typically lags the market because of the time it takes for projects to become feasible, obtain financing, and be developed. As illustrated below, total supply decreased by 4.0% in 2020, attributed largely to the hotel closures resulting from travel restrictions imposed during the pandemic. In 2021 and 2022, national supply grew significantly; in addition to the reopening of many closed hotels, most hotel development projects completed during those years had been planned in or before 2019/20. However, in 2023 and 2024, the addition of new supply slowed to 0.2% and 0.5%, respectively. This slowdown was due to a combination of increasing construction costs and the rising cost of debt, which have hindered new hotel development in recent years. Going forward, supply increases will likely continue to be challenged by these factors, as evidenced in the 2025 and 2026 forecast, where supply is anticipated to grow by only 0.8%.
EXHIBIT 2: NATIONWIDE SUPPLY GROWTH SLOWED IN RECENT YEARS
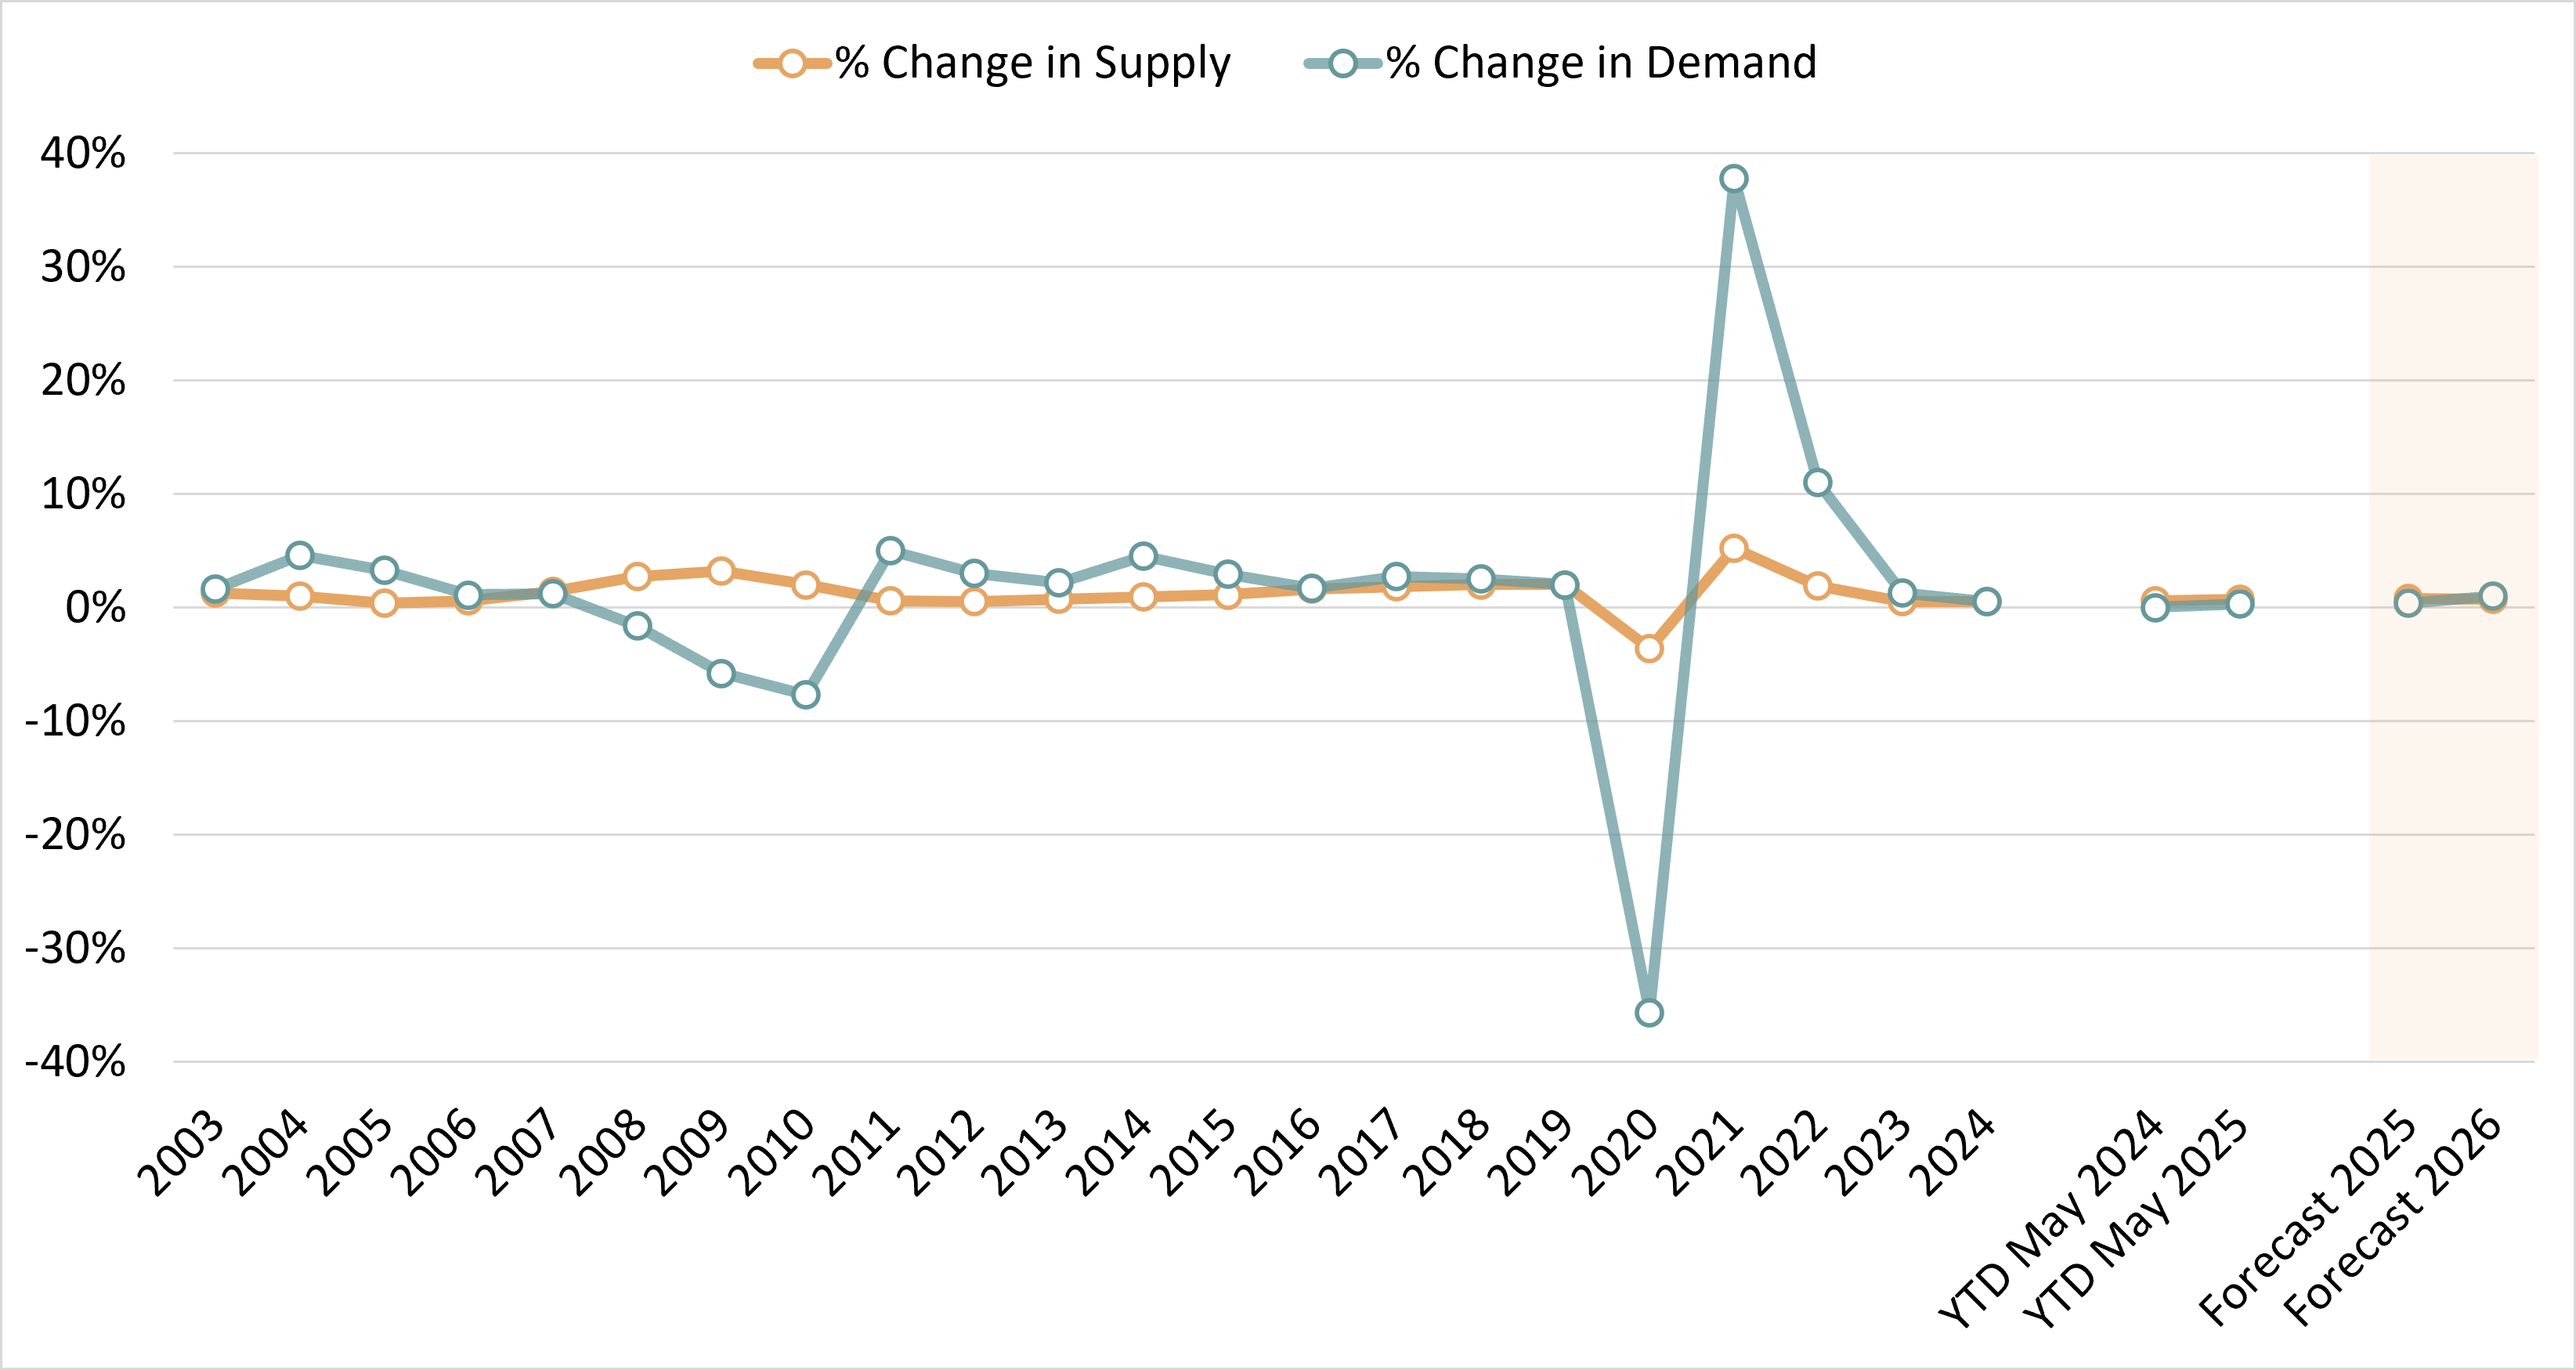
EXHIBIT 3: PACE OF U.S. HOTEL SUPPLY GROWTH EXPECTED TO INCREASE THROUGH 2028
CONSTRUCTION-COST INFLATION
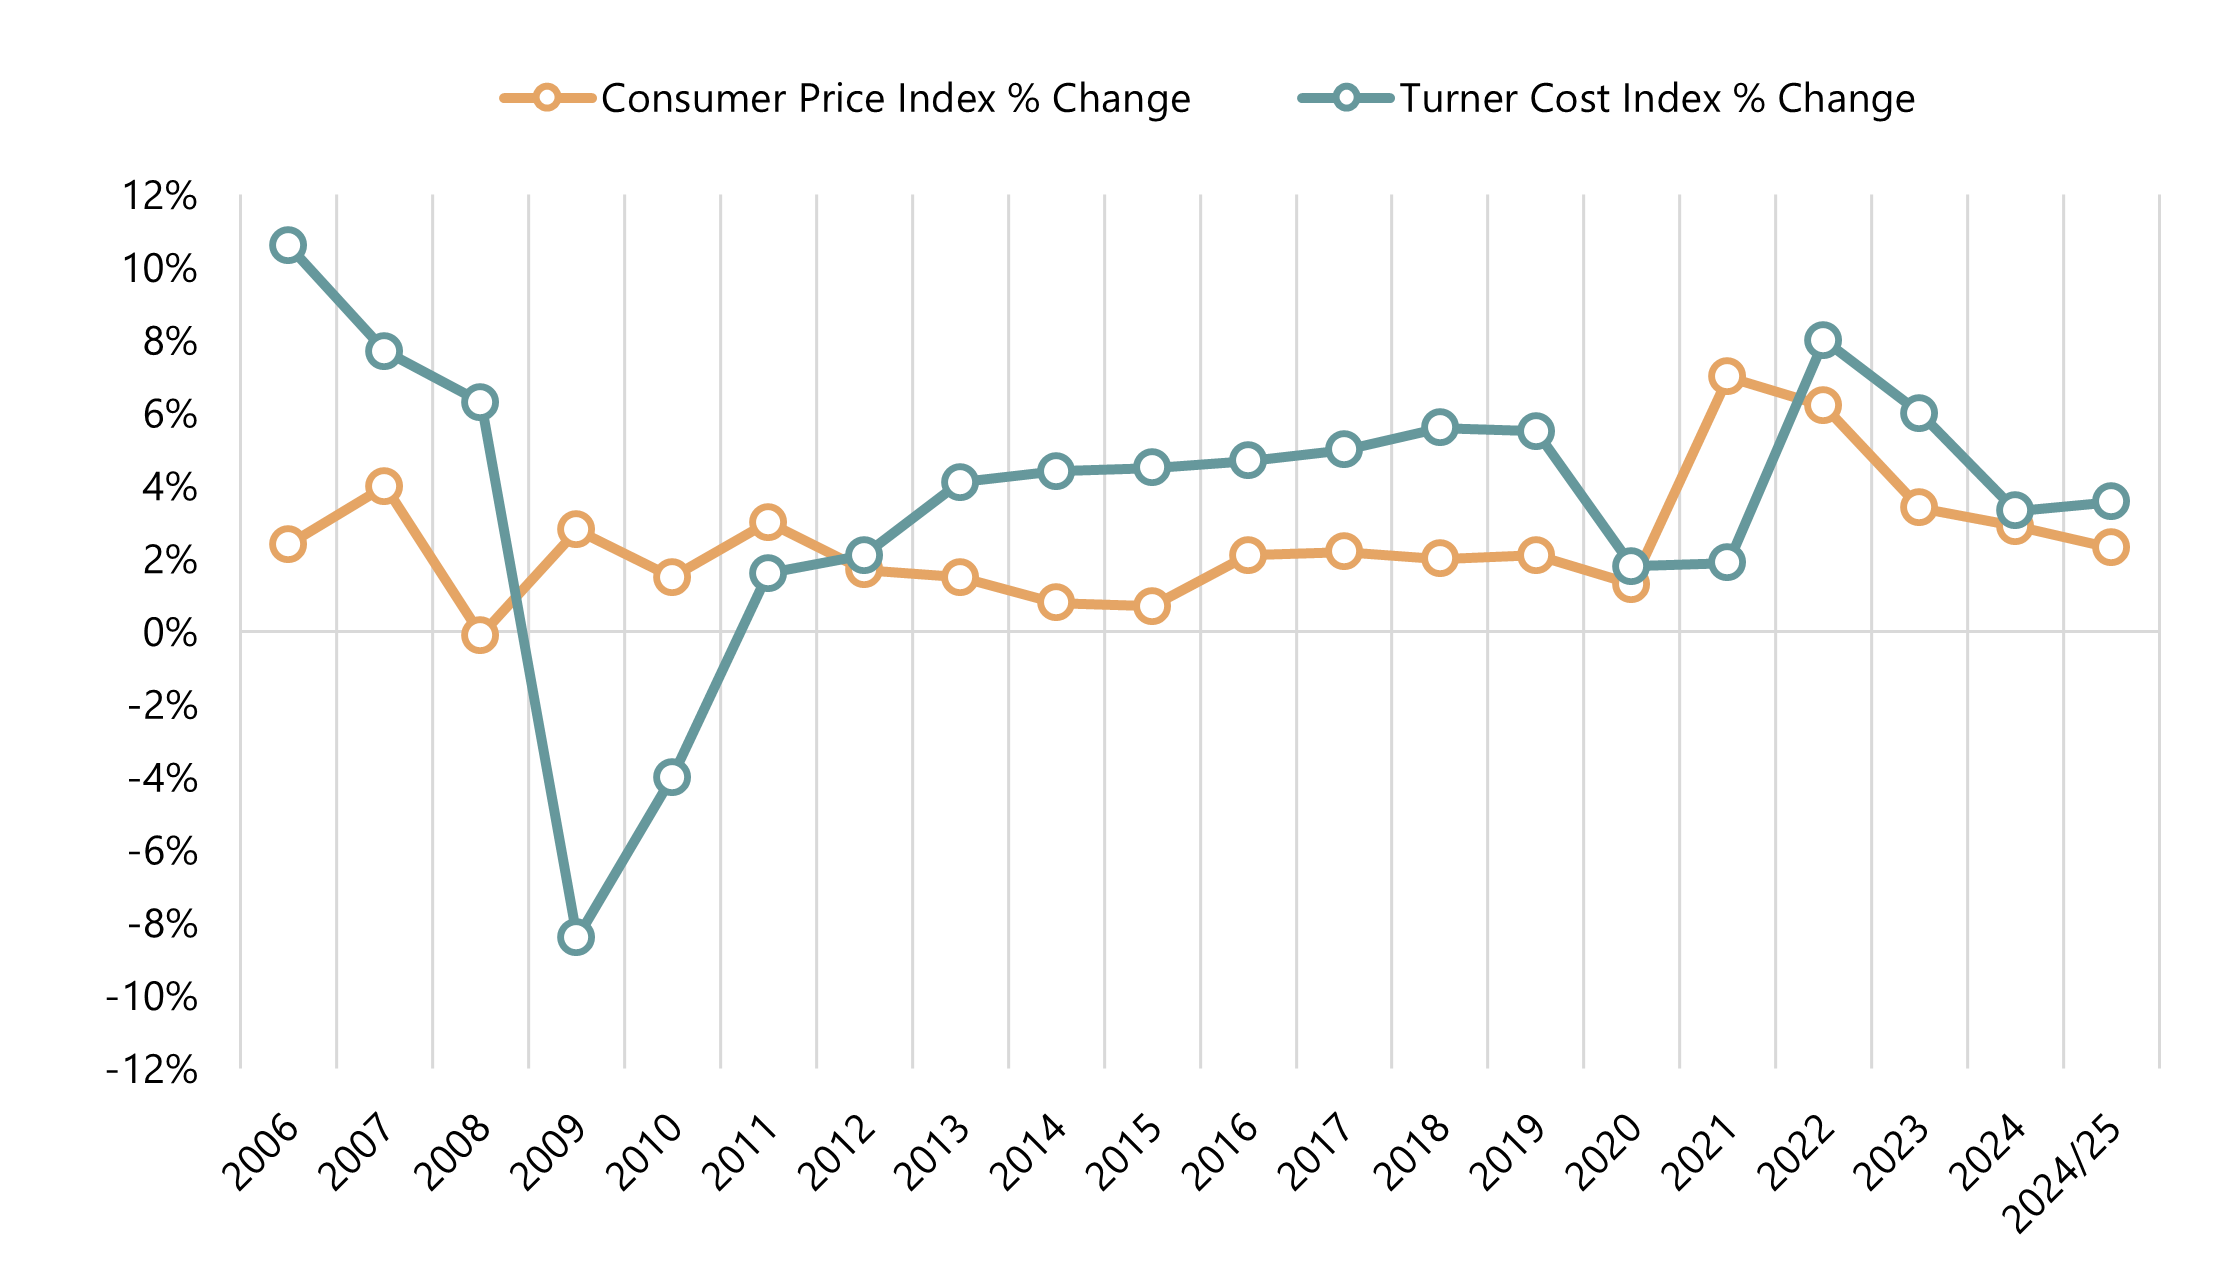
In terms of inflation specifically related to development costs, we present historical information below from the Turner Building Cost Index, which has tracked costs in the non-residential building construction market in the United States since 1967. The Turner Building Cost Index is determined by the following factors on a nationwide basis: labor rates and productivity, material prices, and the competitive condition of the marketplace. The index grew by 5.0% on average from 2014 through 2019, before slowing to 1.8% growth in 2020 and 1.9% growth in 2021; however, the cost index surged by 8.0% in 2022, followed by a 6.0% increase in 2023. Growth of the index fell again to 3.32% in 2024, then rose slightly to 3.57% trailing-twelve-month (TTM) period ending March 2025.As an additional point of reference, Rider Levett Bucknall (RLB), which also compiles a quarterly construction cost report, reported a construction cost index increase of 4.69% for year-end 2024.
The annual changes in the Turner Construction Cost Index compared with the annual changes in the Consumer Price Index (CPI) are illustrated in the following graph.
EXHIBIT 4: COMPARATIVE VIEW OF CONSUMER PRICE INDEX VS. TURNER COST INDEX CHANGES
HOTEL DEVELOPMENT COST CATEGORIES
Evaluating the comprehensiveness of a hotel development budget can often be challenging, as different line items are used, and some components are unintentionally omitted. HVS has been at the forefront of helping developers and industry participants make sense of hotel development costs through the consistent presentation of these costs. Based on our experience reviewing actual developers’ budgets, as well as preparing the annual HVS U.S. Hotel Development Cost Survey, we have created the following summary format for hotel development budgets, which forms the basis for the presented cost categories. We find that these categories are meaningful for hotel professionals when undertaking an analysis related to hotel feasibility, and they provide a basis from which to analyze proposed projects. The following illustration shows the six categories defined by HVS, as well as the typical items associated with each category.EXHIBIT 5: HVS HOTEL DEVELOPMENT COST CATEGORIES
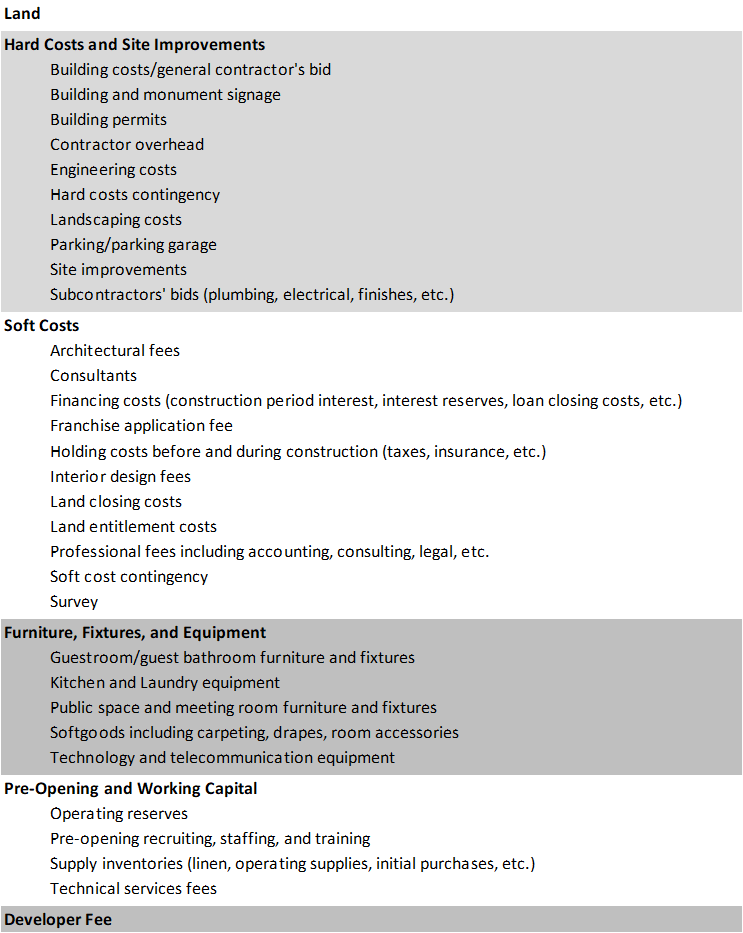
The categories are not meant to be all-encompassing but do reflect the typical items in a development budget. In construction accounting, development budgets are commonly presented in far greater detail than they are in general investment analysis.
DATA COLLECTION AND SAMPLE SIZE
HVS collected actual hotel construction budget data nationwide in 2024. While not every construction budget was captured (for a variety of reasons, including incomplete data, skewed data, or development attributes), our selection includes complete and reliable budgets that form the basis for this year’s survey. The budgets included ground-up development projects throughout the United States. This year, the states most represented in the survey were Florida, California, Texas, and Georgia, to name a few, illustrating where the bulk of hotel development is occurring in the country. Notable in this year’s survey is the number of luxury developments where all-in costs well exceeded $2 million per room.We also examined the lodging product-tier breakdown of our data to further determine the most popular types and brands of hotels that were developed in 2024. In the limited-service category, the top four brands were Hampton by Hilton, Fairfield by Marriott, Holiday Inn Express, and Tru by Hilton. Extended-stay products were the most represented of all categories, with popular brands including Home2 Suites by Hilton, TownePlace Suites by Marriott, Hyatt House, Residence Inn by Marriott, and WoodSpring Suites. Marriott and Hilton were the most represented hotel brands.
PER-ROOM HOTEL DEVELOPMENT COSTS
The averages and medians below reflect a broad range of development projects across the United States, including projects in areas with low barriers to entry and those in high-priced urban and resort destinations.EXHIBIT 6: MEDIAN HOTEL DEVELOPMENT COST STABILIZES SINCE OUR LAST SURVEY
Source: HVS
IN CONCLUSION
The budgets analyzed in this survey were provided directly by the developers, owners, and lenders on both ground-up and conversion hotel projects during the illustrated period. The results of the survey combine the data from actual construction budgets organized across a variety of product types. The results also comprise unique hotel projects that cannot be replicated by the inherent nature of hotel development. As such, we would caution developers against relying on the information to estimate costs for a specific project, as a multitude of factors affect a hotel’s development budget. Thus, we recommend that users of the HVS U.S. Hotel Development Cost Survey consider the per-room amount in the individual cost categories only as a general guide for that category.Construction and FF&E design and procurement firms are the best sources for obtaining hard costs and FF&E costs for a specific hotel project. It is also advised that developers consult more than one source in their hotel development process to more accurately assess the true cost of development. Additionally, the cost should always be adjusted for inflation over the development timeline given that the typical hotel development process can last three to five years. Lastly, we recommend that the projected performance of the proposed hotel be revisited periodically during the development process.
HVS is available to assist owners and developers in all aspects of the hotel development and ownership life cycle, from initial idea through development, opening, and beyond. For further information, please contact Luigi Major at (310) 270-3240 or [email protected].