2010 Manhattan Hotel Market Overview Survey
Result Analysis
Respondents: Members of the Hotel Association of New
York City and the Greater New York Chapter of Hospitality Sales
and Marketing Association International
Prepared by Michael Ahn, Laura Arneson, Monette DeLeon, Zhe Li,
and Jason Sturtevant
Lalia
Rach, Ed.D.
Divisional Dean and HVS International Chair
The Preston Robert Tisch Center for Hospitality, Tourism, and
Sports Management
To paraphrase the lyrics from the song Spinning
Wheel, by Blood, Sweat and Tears, “What goes down, must go up…”
is a good measure for 2010. It will be a year of incremental
recovery for business and consumers. For consumers, the gradual
improvement will depend on the state of employment, the
availability of credit, and the improvement in value of major
assets for these determine the confidence and comfort levels of
travelers and guests. A return by consumers to “old spending
habits” is not realistic in light of the challenges. Post-Great
Recession, the Industry issues that remain include loan
maturation deadlines, cost flow recovery, brand homogenization,
and the reset of the price-value equation. Conventional wisdom
which posits the cyclical nature of Industry recovery is in for
a rough ride as “normal” is anything but. The challenges for
consumers and industry will extend well beyond 2010.
INTRODUCTION
This report presents the results and data analysis of the 2010
Manhattan Hotel Market Overview survey conducted by graduate
students of New York University’s Preston Robert Tisch Center
for Hospitality, Tourism, and Sports Management in collaboration
with HVS Global Hospitality Services. The objective of this
research is to identify hotel professionals’ perspective on the
current economic state of New York City, and determine
specifically whether the Manhattan hotel market is on the road
to recovery.
An online survey was developed and targeted to members of the
Greater New York Chapter of the Hospitality Sales and Marketing
Association International (HSMAI) and the Hotel Association of
New York City (HANYC). The survey was sent to 354 members of
HSMAI and 291 hoteliers from HANYC. Of these members, 3 opted
out of taking the survey, 53 email addresses were invalid, and 4
members expressed they were not the appropriate contact to take
the survey. This eliminated 60 members, resulting in a potential
sample size of 585 members from HSMAI and HANYC. Representing
professions in the sales and marketing, revenue management, and
property operations fields, these hotel leaders serve as an
excellent barometer of the industry climate in New York City and
are most likely to benefit from the knowledge derived from this
study.
Survey questions were limited to those related to operational
themes and strategies that could be reasonably answered by this
particular target audience. Though there were other pertinent
issues that could have been included in the survey, it was
limited to 23 questions to increase the potential response rate.
New York University’s Preston Robert Tisch Center for
Hospitality, Tourism, and Sports Management and HVS Global
Hospitality Services thank all of the respondents for their
participation in this study. We also thank Kathie Stapleton,
Executive Director of HSMAI, and Rick Amato, Vice President of
HANYC, for their support of the survey.
SURVEY FINDINGS
The purpose of the survey is to determine executive attitudes
on when the Manhattan hotel market will enter the recovery phase
of the business cycle. Overall, a total of 68 respondents
started the survey, but only 44 respondents (64.7%) completed
the survey, leaving 24 surveys (35.3%) only partially completed.
This corresponded to a response rate of 11.6% (including both
fully and partially completed surveys).
The general sentiment from respondents indicates that the
Manhattan market has already hit its trough, and as of the first
half of 2010, the market is in the recovery cycle. The 2010
survey indicated that 45% of all respondents expect an increase
of 1-10% in year-over-year demand in all segments. In 2009, only
12.5% of respondents expected a higher annual occupancy;
however, in 2010, 42.1% of all respondents expect year-end
occupancy to increase by 1-5%. The 2009 survey showed that 79.5%
expected their year-end 2009 ADR to be lower than year-end 2008,
while the 2010 survey respondents were more optimistic as 44.7%
of them expect ADR to increase by 1-5%. A high percentage (32%)
of respondents believed that RevPAR will return to peak levels
by 2012. These data support the hypothesis that the recovery
phase for the Manhattan lodging market has begun.
The findings outlined below are based on this 2010 Manhattan
Hotel Market Overview survey. The number of responses for each
question varies; therefore, the analysis reflects the actual
number of answers for the individual question.
“Control” Questions 1-4 Results
-
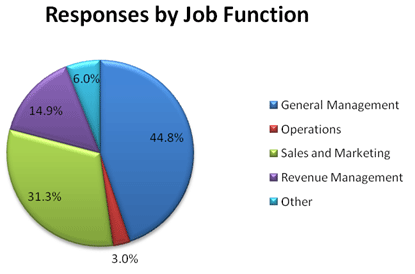
In terms of job functions, more than three
quarters (76.1%) of the respondents were General Managers
(44.8%) and Sales & Marketing staff (31.3%). Revenue
Managers (14.9%), Operations (3.0%), and employees with
other job roles (6.0%) made up the remaining 23.9% of
respondents. Other job functions included Vice President of
Operations, Consultant, and Management Recruiter.
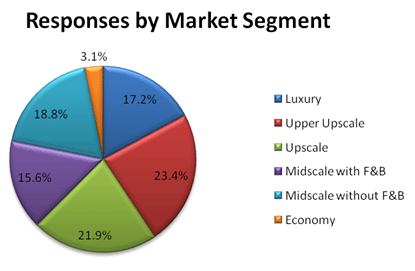
- Focusing on hotel market segments, the top three
participating segments are the Upper Upscale segment (23.4%),
the Upscale segment (21.9%), and the Midscale without F&B
segment (18.8%), which made up 64.1% of the total respondents.
The Luxury (17.2%), Midscale with F&B (15.6%), and Economy
(3.1%) segments constituted the remaining 35.9% of total
respondents.
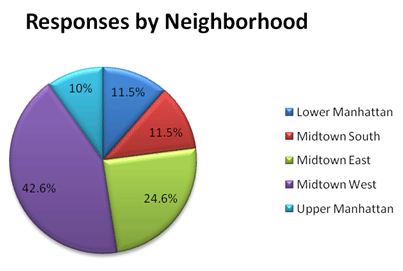
- Examining results by Manhattan neighborhoods, the Midtown
area (Midtown East with 24.6%, Midtown West with 42.6%, and
Midtown South with 11.5%) accounted for 78.7% of the results,
with Lower Manhattan (11.5%) and Upper Manhattan (9.8%) totaling
21.3% of the results.
- Studying results by brand affiliation, the majority of
respondents (66.7%) were in fact brand affiliated. Brand
affiliations include Choice, Hilton, Holiday Inn, Hyatt,
Mandarin Oriental, Marriott, Morgans Hotel Group, Radisson,
Sheraton, Waldorf=Astoria, and Wyndham, among others.
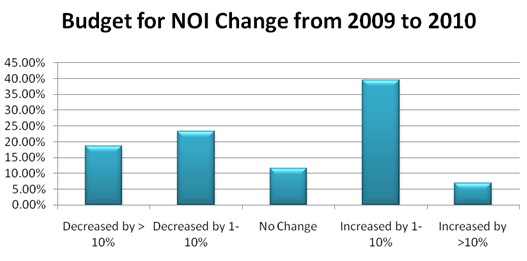
Question 5: How has your budget for Net Operating
Income (NOI) changed for 2010 as compared to 2009?
-
Overall, 46.5% of respondents replied that
they budgeted for an increase in NOI, while 41.9% budgeted
for a decrease, and 11.6% said that there was no change.
- At 39.5% of respondents, an NOI increase of 1-10% was the
most common response.
- At 23.3% of respondents, an NOI decrease of 1-10% was the
second most common response.
- It is interesting to note that 56% of hoteliers working in
higher-end properties (Upscale to Luxury) responded that NOI was
budgeted to increase, while the majority (44.4%) of hoteliers
working in lower-end properties (Economy to Midscale) reported
that NOI was budgeted to decrease.
- It is also worthy to note that 53.1% of hoteliers working in
Midtown Manhattan (East, West and South) responded that NOI was
budgeted to increase, while 66.7% of hoteliers in Upper and
Lower Manhattan reported that NOI was budgeted to decrease.
- Finally, 56% of hoteliers working in branded hotels responded
that NOI was budgeted to increase, while the majority (47.1%) of
hoteliers working in independent hotels reported that NOI was
budgeted to decrease.
Question 6: What is the projected percentage change
in RevPAR from Q1 2010 through Q4 2011?
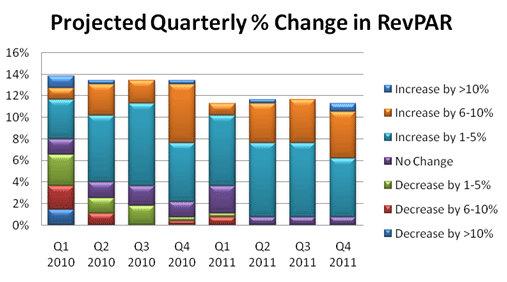
- Overall, the most common response was a quarter-over-quarter
percentage growth in RevPAR of 1-5% (frequency of response:
26.3% to 59.4%).
- When broken down by job function, General Managers, Sales &
Marketing Executives, and Revenue Managers were more optimistic
about higher levels of RevPAR growth in 2011.
- Of all job functions, General Managers were the least
optimistic, with the majority indicating that positive RevPAR
growth will probably first occur in Q2 2010.
- Hoteliers working in higher-end properties (Upscale to
Luxury) generally anticipated immediate quarterly RevPAR growth,
while many hoteliers in lower-end properties (Economy to
Midscale) expected that positive growth would not be seen until
Q2 or Q3 of 2010.
- Hoteliers in Midtown East were the most optimistic, with the
majority of responses indicating that positive RevPAR growth
would be seen in Q1 2010. Hoteliers in Midtown West, Midtown
South, and Upper Manhattan generally replied that this would
occur in Q2 2010. The least optimistic neighborhood was Lower
Manhattan, where the responses were highly fragmented and only
converged to indicate that continuous RevPAR growth would be
seen as of Q2 2011.
- The majority of independent hoteliers believed that positive
RevPAR growth would not occur until Q2 2010, while branded
hoteliers were generally more optimistic and indicated that
positive RevPAR growth would be realized in Q1 2010.
Question 7: Please indicate the first quarter in
which positive RevPAR growth is expected.
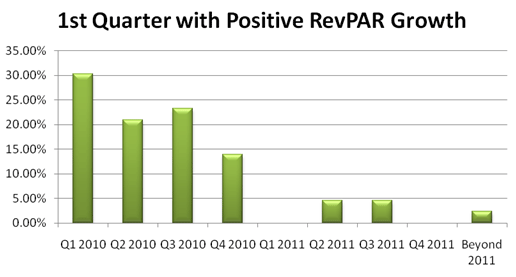
- Overall, 88.4% of respondents reported that their hotels
would experience positive RevPAR growth in 2010.
- 51.2% of respondents believed that their hotels would
experience positive RevPAR growth in the first half of 2010,
while 37.2% said it would be the second half of 2010.
- At 30.2% of respondents, Q1 2010 was the most common
response.
- It is interesting to note that 70.8% of hoteliers working in
higher-end properties (Upscale to Luxury) responded that
positive RevPAR growth would first be experienced in the first
half of 2010, while the majority (50.0%) of hoteliers working in
lower-end properties (Economy to Midscale) reported that it
would come in the second half of 2010.
- It is also interesting to note that 60.0% of hoteliers
working in branded hotels responded that positive RevPAR growth
would first be experienced in the first half of 2010 while the
majority (50.0%) of hoteliers working in independent hotels
reported that growth would occur in the second half of 2010.
Question 8: When do you expect your RevPAR to return
to 2008 peak levels?
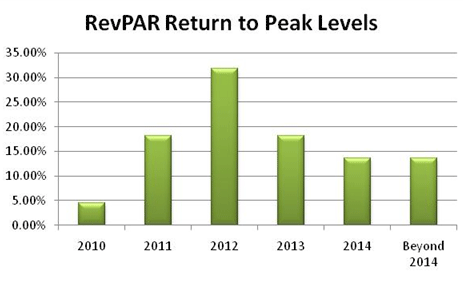
- Overall, 68.2% of hoteliers believed that their RevPAR would
return to 2008 peak levels from 2011 to 2013.
- With 31.8% of responses, 2012 was the most common response.
- It is interesting to note that hoteliers working in branded
hotels tended to feel more strongly that RevPAR would return to
2008 peak levels in 2012 (42.3%), while hoteliers working in
independent hotels were split between 2011 and 2013 (37.5% and
31.3%, respectively).
Question 9: Please rank the following strategies by
importance in 2010, with 1 as the least important and 5 as the most
important.
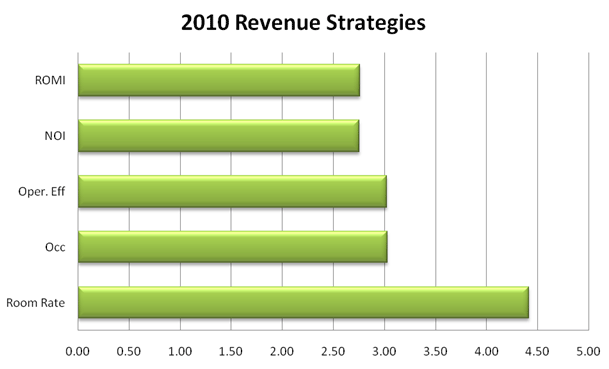
- Maximizing room rate, occupancy, and operational efficiency
were the top three strategies for increasing revenue in 2010,
with rankings of 4.41, 3.03 and 3.02, respectively.
- 43.9% of all respondents reported that maximizing room rate
would be the best strategy for 2010, while only 2.5% of
respondents stated that room rate would not be a strategy for
2010.
- Between 49-53% of respondents (depending on chain scale,
location, and brand affiliation) reported that occupancy would
be a key strategy in 2010.
- On average, 26.2% of respondents stated that Operational
Efficiency would be the best strategy for their properties in
2010.
- The majority of respondents reported that Return on Marketing
Investment (ROMI) was the least important strategy for 2010.
52.2% of General Managers responded accordingly.
- Lower Manhattan respondents were least concerned with room
rates as a strategy for 2010, with none of them identifying room
rate strategy as greatly important, compared to 66.7% of Midtown
West respondents, who identified it as the greatest strategy for
2010.
- 48.0% of respondents from branded properties believed room
rate was the most important strategy, while 31% of respondents
from independent properties thought the same.
Question 10: With the Manhattan market expected to
add approximately 10% more rooms within the next two years, do you
think this influx will have an impact on your property?
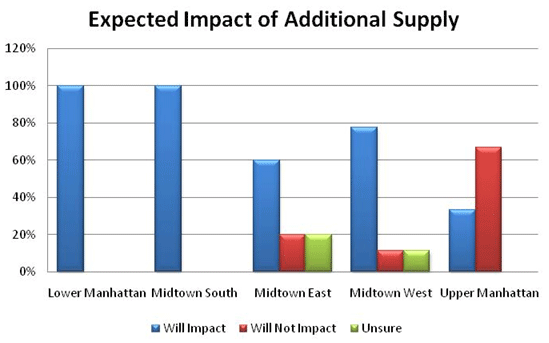
- 73.3% of respondents reported that the expected increase in
room supply in Manhattan will have an impact on their property.
Of those respondents, 70% are General Managers.
- 71.4% of respondents from all chain scales agreed that the
influx of supply will have an impact on their property.
- Those properties most concerned with the influx of supply over
the next two years are located in Lower Manhattan, Midtown
South, and Midtown West, with 100%, 100%, and 77.8% respondents,
respectively.
- 81.3% of hotel professionals at independent properties claim
that the influx of room supply will have an impact on their
properties compared to 69.2% of hotel professionals at branded
hotels.
Question 11: Please rank which of the following will
be affected the most by the new supply, with 1 having the least
impact and 3 having the most impact.
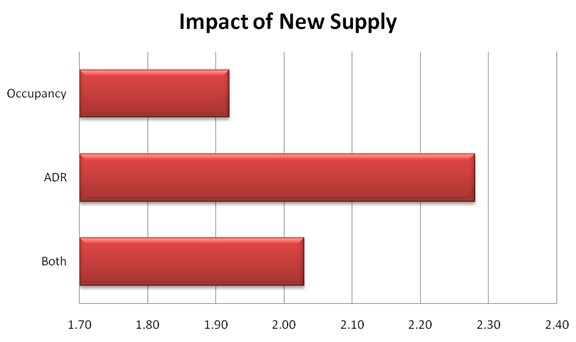
- Results from the survey indicate that ADR will be affected
the most by the new supply, with a weight of 2.28. “Both
occupancy and ADR will be affected equally” came in second with
a rank of 2.03, and finally, respondents indicated that
occupancy would have the least impact, with a rating of 1.92.
- 48.0% of respondents who reported that the new supply would
have great impact identified ADR as the revenue factor that
would be affected the most.
- 47.1% of respondents agreed that the new supply would have the
greatest impact on both indicators.
- 100% of respondents from the luxury chain scale stated that
both indicators would be greatly impacted by the new supply
expected.
- 50% of respondents from both branded and independent
properties believed that both indicators would be impacted by
the new room supply.
- The majority of all respondents across geographic location –
Lower Manhattan, Midtown South, Midtown East, and Midtown West –
anticipated the new supply to greatly impact both indicators,
with responses of 50.0%, 50.0%, 60.0%, and 75.0%, respectively.
Question 12: Please rank the following distribution
channels for rooms revenue generation with 1 as the least and 5 as
the greatest revenue generator.
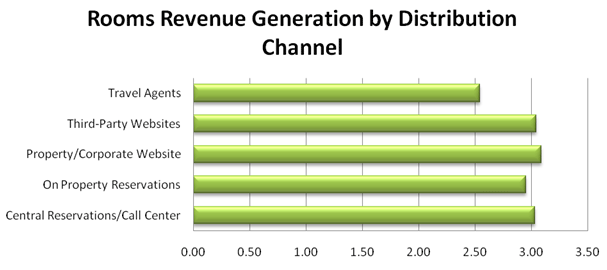
- The top three rooms revenue generators were found to be the
property/corporate website, third-party websites, and the
central reservations/call center, with scores of 3.09, 3.04, and
3.03, respectively.
- Respondents indicated that travel agents are the least
effective in revenue generation, with a rating of 2.54.
- 27.9% of respondents rated property reservations as the most
important channel of distribution, while 30% ranked it as the
least.
- 31.8% of GMs believed that the Central Reservations/Call
Center is the least effective channel of revenue distribution.
- 37.5% of Revenue Managers stated that the Central
Reservations/Call Center is the least effective channel of
revenue distribution.
- 37.0% of hotel professionals who work at branded properties
believe that the Central Reservations/Call Center is the best
revenue generator compared to 20.0% of hotel professionals at
independent properties.
Question 13: In 2009, what was the revenue generated
from your brand reservation system?
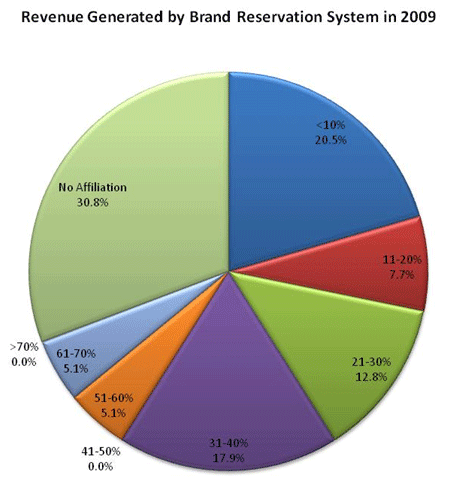
- The majority of respondents (30.8%) were not affiliated with
a brand and therefore did not rely on brand reservation systems.
- 20.5% of respondents reported that less than 10% of their 2009
revenue was generated from brand reservation systems.
- 75.0% of Luxury hotel respondents received less than 10% of
their revenue from brand reservations systems. Comparatively,
23.1% of Upper Upscale respondents reported that they received
41-50% of their revenue from brand reservations systems.
- None of the chain scales reported receiving over 70% of their
revenue through their brand reservations systems. Only 14.3% of
Midscale properties with Food and Beverage reported seeing
61-70% of their revenue from brand reservations systems.
Question 14: What percentages of your guests fit the
following categories?
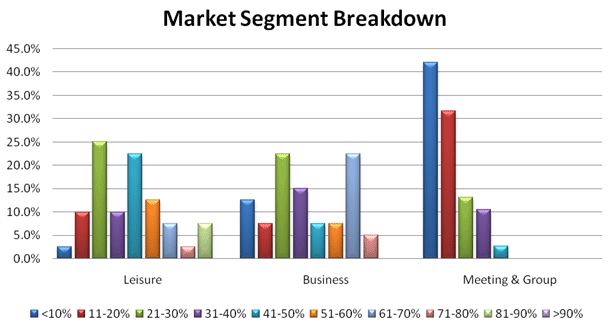
- A majority of survey respondents (25%) indicated that the
leisure segment accounted for 21-30% of their hotel guests.
- 22.5% of the survey respondents indicated that the business
segment makes up 21-30% of their hotel guests, while another
22.5% of the survey respondents indicated that the business
segment represents 61-70% of their guests.
- A majority of survey respondents (42.1%) indicated that the
meeting & group segment represents less than 10% of their hotel
guests.
Question 15: How do you anticipate that demand for
your hotel in 2010 will change from the 2009 level in the following
guest categories?
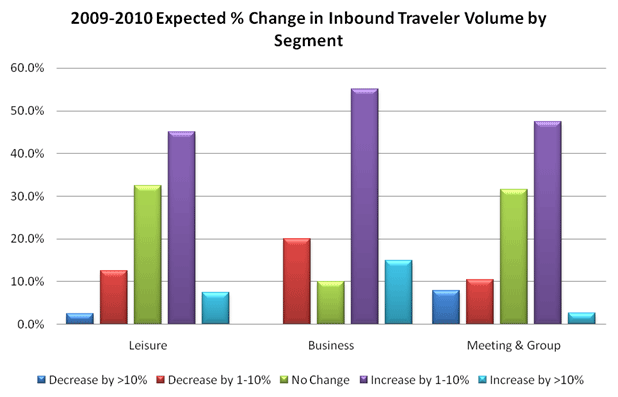
- Overall, more than 45% of the respondents anticipate that
demand will increase by 1-10% across all segments.
- In the leisure segment, the majority of respondents (45.0%)
anticipate that demand will increase by 1-10%.
- For the business segment, the majority of respondents (55.0%)
anticipate that demand will increase by 1-10%.
- Finally in the meeting & group segment, the majority of
respondents (47.4%) anticipate that demand will increase by
1-10%.
- Respondents working in higher-end (Upscale to Luxury) hotels
display a more positive attitude than lower-end chain segments
respondents (Economy to Midscale) with regards to the business
and meeting & group segments. In higher-end properties, 76.2% of
the hoteliers expect meeting & group demand to increase, while
62.5% of hoteliers in lower-end properties predict that meeting
& group demand will not change or will even decrease. According
to 66.7% of Luxury hoteliers, business demand will increase more
than 10%, 61.8% of the Upper Upscale to Midscale without F&B
expect business demand will increase by 1-10%, and 100% of the
Economy scale hoteliers expect business demand will not change.
- It is important to note that in terms of leisure business,
certain neighborhoods display more resistance to recovery than
others. 50% of Lower Manhattan and Midtown East hoteliers
indicate that there will be no change in leisure demand. 53.8%
of Midtown South, Midtown West, and Upper Manhattan hoteliers
anticipate a 1-10% increase in leisure demand.
- Hoteliers in Midtown South are less confident than those from
other neighborhoods with regards to the business and meeting &
group segments. 50% of Midtown South hoteliers expect there will
be no change in the above segments, while 56.1% of hoteliers in
other neighborhoods expect a 1-10% increase in these segments.
Question 16: How did the volume of your domestic
traveler segment change in 2009 compared to the volume for the prior
year?
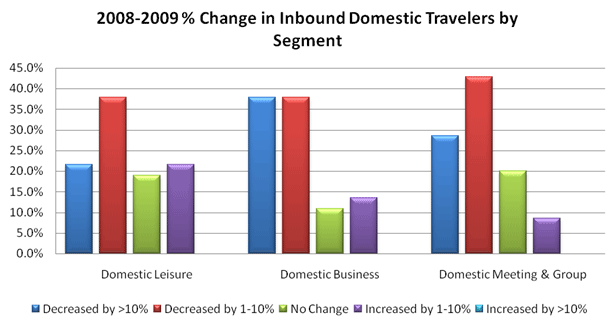
- More than 37.8% of the overall survey respondents indicated
that domestic demand decreased 1-10% across all segments in
2009.
- In terms of the domestic leisure segment, 37.8% of the
respondents indicated that demand decreased 1-10% in 2009.
- With regards to the domestic business segment, 37.8% of the
respondents indicated that demand decreased 1-10% in 2009, while
another 37.8% reported that demand decreased more than 10%.
- As for the domestic meeting & group segment, 42.9% of the
respondents indicated that demand decreased 1-10% in 2009.
- Upper Upscale is the only segment in which most hoteliers
(50%) experienced positive growth in domestic leisure demand,
while 63% of other segments experienced a decrease in domestic
leisure demand in 2009.
- Lower Manhattan is the only neighborhood where most of the
hoteliers experienced positive growth in domestic leisure
demand. Specifically, 50% of the Lower Manhattan hoteliers
reported a 1-10% increase in domestic leisure demand, while
61.3% of hoteliers in other neighborhoods experienced a decline
in domestic leisure demand.
- Independent hotels experienced a steeper decline in domestic
business demand than branded hotels. Specifically, 42.9% of
independent hoteliers reported a more than 10% decline in
domestic business demand, while 50% of branded hoteliers
reported a 1-10% decline.
Question 17: Please rate each of the following
factors in terms of its importance in attracting domestic guests to
Manhattan hotels.
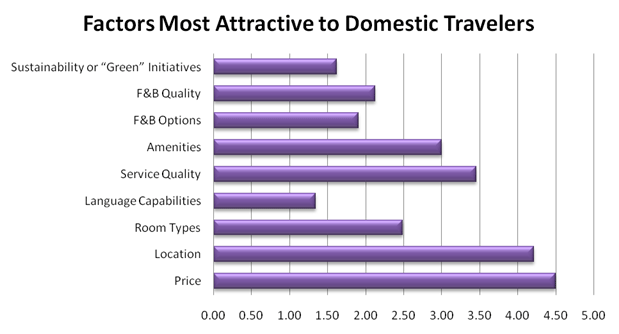
- Price, location, and service quality are ranked the top 3
most important factors in attracting domestic guests to
Manhattan hotels, with ratings of 4.5, 4.21, and 3.45,
respectively.
- Language capabilities, sustainability initiatives, and F&B
options are ranked the 3 least important factors to attract
domestic guests, with ratings of 1.34, 1.62, and 1.90,
respectively.
- The Luxury segment is less price-sensitive than other chain
scales. Hoteliers in this segment ranked location as the most
important factor, with a 4.75 rating, and rank price as the
second most important factor, with a 4.50 rating. Hoteliers of
the other chain scales rank price as the most important factor,
with an average rating of 4.51.
- The Midtown East neighborhood is less price-sensitive than
other neighborhoods. The hoteliers in this neighborhood rank
location as the most important factor, with a 4.44 rating, and
rank price as the second most important factor, with a 4.11
rating. Hoteliers of the other chains rank price as the most
important factor, with an average rating of 4.60.
- Price, location, and service quality are the top 3 factors for
General Managers and Sales and Marketing staff. Meanwhile, in
addition to these factors, amenities is among the top 3 factors
for Operations and Revenue Management staff.
Question 18: Did the volume of your 2009
international traveler segment change compared to the level for the
prior year?
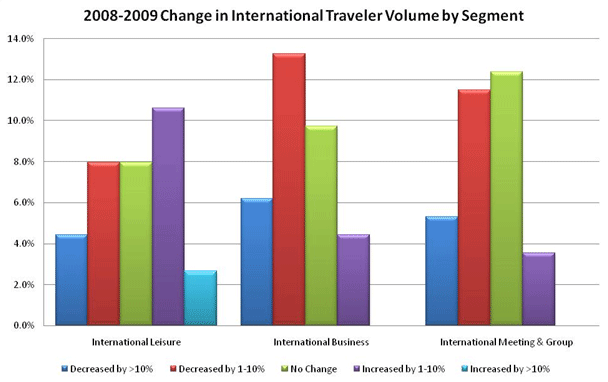
- About 32.7% of Manhattan hotels experienced a 1-10% decrease
in overall international travel volume, with the highest drop
noted in the international business traveler segment.
Additionally, 30.1% of the hotels experienced no change in
international travel segments, while 18.6% experienced a 1-10%
increase, with the highest increase seen in the international
leisure segment.
- Overall, 18.6% of respondents anticipate international inbound
traveler volume to increase by 1-10% across all segments.
- In the international leisure segment, 10.6% of the respondents
anticipate that demand will increase by 1-10%, which is the
majority for this particular segment.
- For the business segment, the majority of respondents (13.3%)
anticipate demand to decrease by 1-10%.
- As for the meeting & group segment, the majority of
respondents (12.4%) reported no change in demand.
- Surprisingly, only 5.3% of Luxury segment respondents
experienced a 1-10% decrease in the international business
segment, with 13.2% of Midscale with F&B hotels showing the
highest drop in this segment. About 10.5% of respondents in
Upscale hotels saw the greatest increase in international
leisure travelers.
- The Midtown West area saw the greatest fluctuations in
international travel, with a 27.8% decline in international
business travelers, as well as a 20% decrease in the
international meeting & group segment.
- 24.8% of both brand-affiliated and independent properties saw
the greatest declines of 1-10% in the international business and
international meeting & group segments.
Question 19: Please rate each of the following
factors in terms of its importance to attracting international
guests to Manhattan hotels.
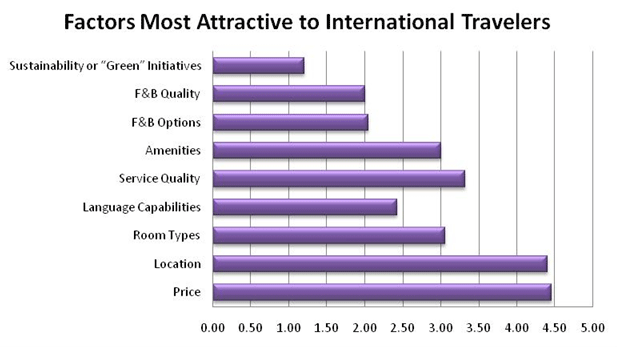
- Price, location, and service quality were ranked as the top 3
most important factors in attracting international guests to
Manhattan hotels, with ratings of 4.45, 4.40, and 3.32,
respectively.
- Sustainability initiatives, F&B quality, and F&B options were
ranked the 3 least important factors to attract international
guests, with ratings of 1.20, 2.00, and 2.05, respectively.
- Although international travelers who stay at Luxury segment
hotels are seemingly less price-sensitive than international
travelers at other chain scales, hoteliers ranked price and
location as the two most important factors in attracting these
particular travelers, with ratings of 4.5 and 4.8, respectively.
- Midtown West was the most price-sensitive neighborhood for
international guests, rating price at an average of 4.6 out of
5. On the other hand, Midtown East was the least price-sensitive
neighborhood for this segment, rating price at an average of 4.2
out of 5.
- Price, location, and service quality were ranked as the top 3
most important factors for attracting international travelers by
General Managers and Sales and Marketing staff. Amenities also
ranked highly among General Managers and Revenue Managers, with
ratings of 3 out of 5, and 3.3 out of 5, respectively.
Question 20: Which 3 countries/regions are the
strongest generators of international travelers to your hotel?
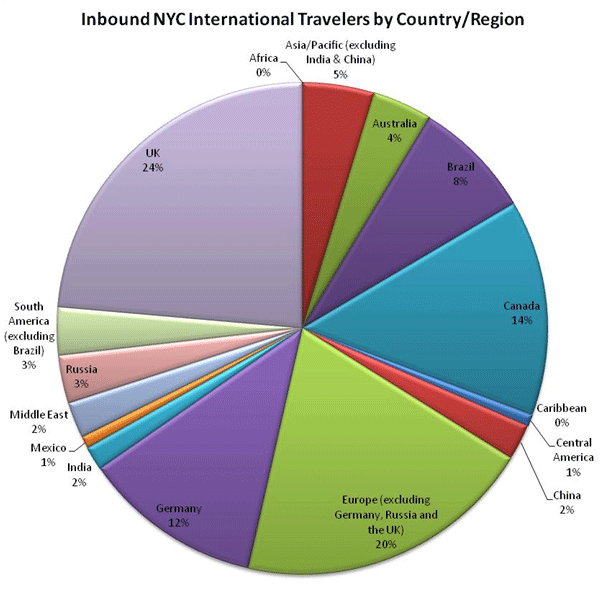
- Results indicated that the top 3 countries/regions that
generate the highest volume of international travelers are the
UK with 23.6%, Europe (excluding Germany, Russia, and the UK)
with 19.7%, and Canada with 14.2%.
- Results from General Managers reflected the above results.
However, results from Sales & Marketing respondents showed
Canada tied with Germany as the third country/region, while
results from Revenue Managers rated Brazil and Germany tied as
the third country/region.
- Brazil ranked highly in Midtown East and Upper Manhattan
properties, while Germany also ranked highly in Lower Manhattan
and Midtown West hotels.
- Independent hoteliers responded that the UK, Europe (excluding
Germany, Russia, and the UK), and Germany were their top 3
countries/regions.
Question 21: By what percent do you expect your room
rates to change from 2009 to 2010?
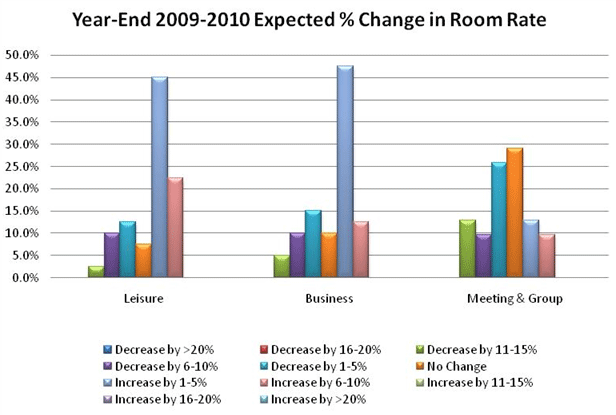
- Almost 50% of all respondents expect the leisure, business,
and meeting and group segments to increase between 1% and 10%.
29% percent of all respondents expect the meeting and group
segment to have no change, and decreases of 1-5% are expected by
15.0% of respondents in the business segment, and 12.5% in the
leisure segment.
- 52% of branded hotels expect leisure room rates to increase
1-5% from 2009 to 2010.
- 35.7% of independent hotels expect an increase in room rate of
1-5%, while 28.5% of the same group expect an increase of 6-10%
in the leisure segment.
- Much like the leisure segment, 52% of branded hotels expect an
increase of 1-5%. Different from the leisure segment, 43% of
independent hotels expect an increase of 1-5%.
- On the meeting and group segment side, branded hotels are
split, with 24% in each of these categories: increase 1-5%, no
change, and decrease 1-5%.
- Of the independent hotels, 46% expect a 1-5% increase, while
30% expect a decrease of some kind.
- When broken down by chain scale segment, 82% and 87% of Upper
Upscale and Upscale, respectively, expect some kind of increase
in room rate, while only 66% of Midscale with F&B and 50% of
both Economy and Luxury segments expect increases.
Question 22: How do you expect your hotel's year-end
2010 ADR to compare to ADR as of year-end 2009?
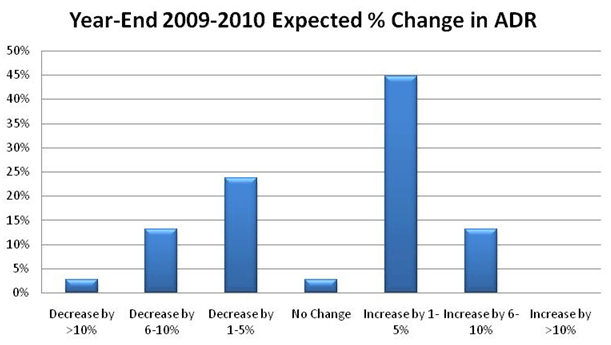
- Overall, 44.7% of respondents expect ADR to increase in 2010
by 1-5%; however, 23.7% expect a decrease of 1-5% in ADR. Only
15.8% expect ADR to decrease more than 5%, and only 13.2% expect
an increase of more than 5%. No respondents expect more than a
10% increase in ADR year over year.
- 50.0% of independent hotels expect an increase of 1-5% in ADR,
while only 39.1% of branded hotels agree. 22.7% of branded
hotels expect a decrease of 1-5%, and 17% expect a decrease of
6-10%.
- 40.9% of General Managers expect an increase of 1-5% in ADR as
do 47% of Sales and Marketing respondents. Twenty percent of
Sales and Marketing respondents expect a decrease of 6-10% in
ADR, while 13.6% of General Managers expect a 6-10% increase in
ADR.
Question 23: How do you expect your hotel's year-end
2010 occupancy to change from the year-end 2009 level?
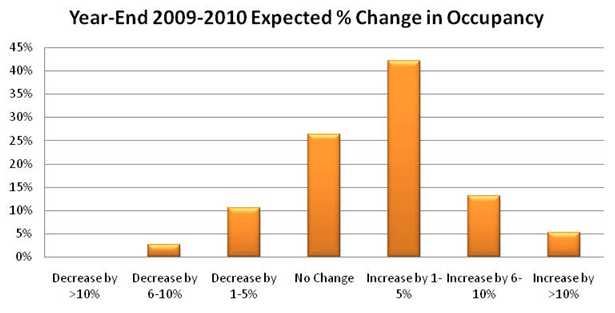
- 42.1% of all respondents expect year-end occupancy for 2010
to increase by 1-5%, while 26.3% of all respondents expect no
change. 13.2% of all respondents expect a decrease, while 60.5%
of all respondents expect an increase in year-end occupancy.
- 30.4% of hoteliers in branded hotels indicate that they do not
expect any change in occupancy while 64.3% of hoteliers in
independent hotels say they expect an increase of 1-5%.
- 28.5% of General Managers responded that there would be no
change, while 38.1% answered that there would be a 1-5%
increase, and 19% forecasted a 6-10% increase.
- 43.7% of Revenue Managers and Sales and Marketing Executives
also expect a 1-5% increase, while 25% expect no change.
- 45.4% of Upper Upscale hotels expect an increase of 1-5%,
while 66.6% of Midscale with F&B hotels expect no change.
YEAR OVER YEAR COMPARISON
The following analysis is a comparison between years 2009 and
2010 based on the Manhattan Hotel Market Overview survey results. In
addition to a general edit of the 2009 survey, five questions were
removed and four new questions were added to make the 2010 survey
more relevant to the theme of hotel market recovery.
- The 2009 survey indicated that the majority (74%) of all
respondents expected a decrease in demand in their leisure
market, while the most common response in the 2010 survey was
that 45% of all respondents expect a 1-10% year-over-year demand
increase in the leisure segment.
- In the business segment, 2009 respondents were less optimistic
as 85% anticipated a decrease in their year-over-year demand,
while 55.0% of all 2010 respondents anticipated an increase of
1-10% in business demand.
- In terms of the meeting & group segment, a majority of 2010
respondents (47.4%) anticipate that demand will increase by
1-10%, while in 2009, 67.2% anticipated a decrease in demand for
that year.
- The majority of 2009 survey respondents reported a decrease of
less than 10% in their domestic leisure travelers for 2008. They
also reported a decrease in domestic business and domestic
meeting & group demand of greater than 10% in the same year.
However, the 2010 survey indicates that the decrease in the
domestic business and domestic meeting & group segments has
slowed, as the majority reported a 1-10% decrease across all
domestic segments in 2009.
- The majority of respondents in both 2009 and 2010 reported a
decrease in international travelers over the respective prior
years, with the highest drop in the international business
traveler segment. Both surveys indicated that the top three
countries/regions that generate the highest volume of
international travelers are the UK, Europe, and Canada.
- In 2009, only 12.5% of respondents expected a higher annual
occupancy, with the majority of all respondents anticipating a
lower occupancy; however, according to the 2010 survey, 42.1% of
all respondents expect year-end occupancy for 2010 to increase
by 1-5%, while 26.3% of all respondents are expecting no change.
- With regard to ADR, the 2009 survey showed that 79.5% of
respondents expected their year-end ADR for 2009 to be lower
than for year-end 2008. The 2010 survey respondents were more
optimistic, as 44.7% expect ADR to increase by 1-5%.
- In 2009, the three most important strategies were maximizing
occupancy, maximizing room rate, and maximizing operational
efficiency, in that order. In 2010, however, respondents
indicated that maximizing room rate was of the greatest
importance, while maximizing occupancy and operational
efficiency were tied for second.
- In 2009, third-party websites was ranked as the top
distribution channel while property/corporate websites was rated
the top in 2010. This displays the hoteliers’ efforts in
maximizing room rate as the costs associated with using
third-party websites to sell rooms are high.
CONCLUSION
This survey research indicates that Manhattan hoteliers are
confident that the recovery phase in the business cycle has begun.
The general expectation from the respondents is that there will be
an increase in demand from all segments of the market, and
year-over-year occupancy will increase. ADR and RevPAR are also
expected to increase; however, RevPAR is not expected to return to
peak levels until 2012.
Maximizing room rate, occupancy, and operational efficiency are
at the top of all hoteliers strategies for increasing revenue in
2010. However, it is anticipated that this will be difficult due to
the increase in room supply in Manhattan, which will have an impact
on existing hotels.
This project will contribute to the New York City hotel industry
by providing a comprehensive understanding of how the economy
affects the hotel industry, especially the perspective on the
current economic state of New York City and its stage in the
business cycle. This research is also significant in identifying
future trends and how these trends will affect the New York City
hotel market specifically. In addition, the project has provided
valuable information on the Manhattan hotel market in 2010 and can
serve as a reference for future research.
<<Previous
Next >> |


