| |
Manhattan Operating
Statistics by Hotel Segment
George
Fertitta
CEO, NYC
& Company
In early January, New York City announced
that it was the most popular tourist destination in the United
States in 2009, surpassing rival cities such as Los Angeles
and Orlando by welcoming 45.25 million tourists. This accomplishment
marked a first for NYC in nearly 20 years, with its total number
of visitors exceeding projections, declining just 3.9 percent
from 2008 versus the expected 10 percent. 2010 looks to be an
even greater year, with a forecasted 3.2 percent increase in
tourism and an expected 46.7 million visitors to New York City.
In late March, NYC & Company announced a two-year comprehensive
partnership with American Airlines consisting of an integrated
domestic and international media campaign, aimed at attracting
additional visitors to New York City and staying on track to
meet the Mayor’s mandate to reach 50 million visitors
annually by 2012. This year also promises significant hotel
development, with more than 6,700 rooms slated to open in 36
properties, bringing the City’s hotel inventory to nearly
87,000 by year end; these will include several new hotels in
Lower Manhattan, Brooklyn, and Queens.
HVS Global Hospitality Services has analyzed data provided
by STR Global to illustrate the effects of the current
state of the economy on different classes of hotels in Manhattan.
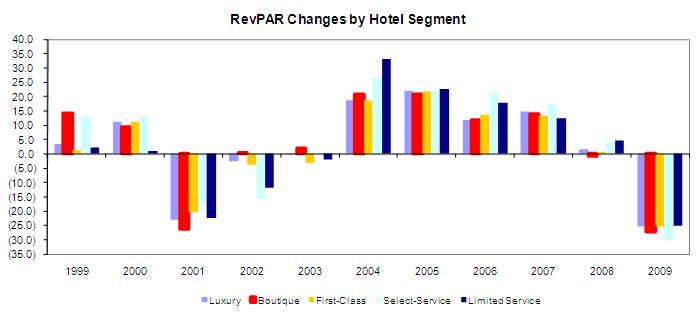
The following graph presents the annual percentage RevPAR changes
since 1999 for the luxury, boutique, first-class, select-service,
and limited-service hotel segments.
The following graphs compare the supply and demand changes, categorized
by individual hotel segment, for all reporting hotels in Manhattan,
using the historical data available through 2009. We note that
the annual periods vary.
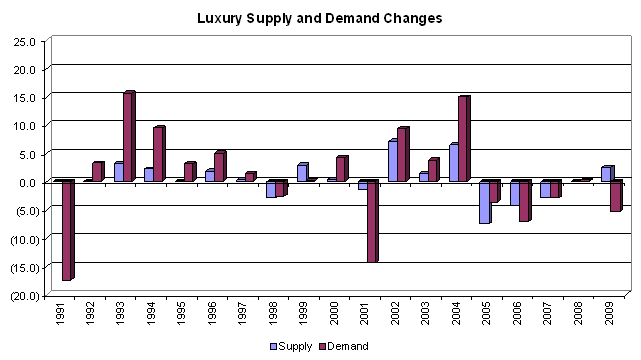
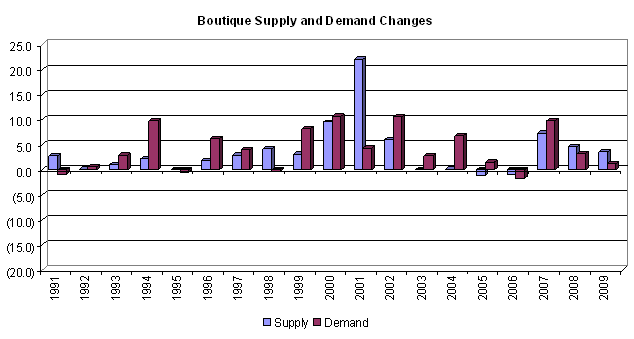
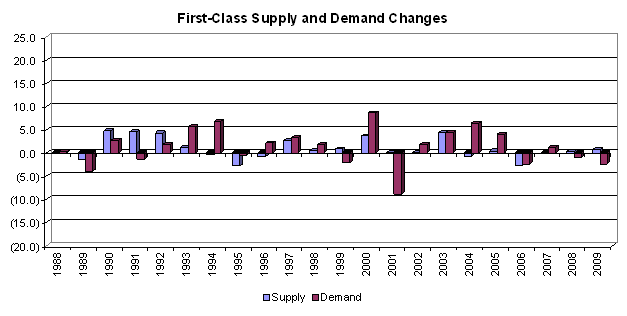
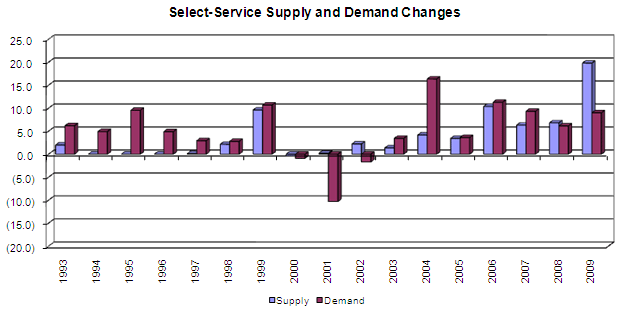
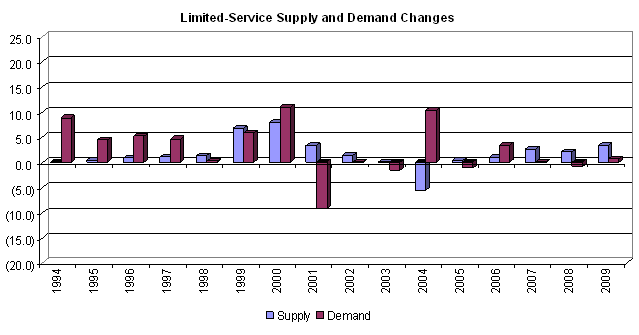
A review of the previous charts reveals the following:
-
Despite the recent tumultuous economic
times and the previous recessions that affected the Manhattan
hotel market, all segments still experienced overall growth
in demand stronger than the growth in supply during the observed
periods, indicating the strength of the Manhattan market.
-
The luxury segment experienced the slowest
growth in supply, expanding at an average annual compounded
rate of 0.4% from 1990 to 2009, and representing a net addition
of roundly 580 rooms only. As a result of the closing of several
luxury hotels for conversion to condominiums, supply within
the luxury segment decreased by roundly 14% between 2004 and
2007. The change in supply in 2009 resulted from the reopening
of 150 transient rooms at the Mark Hotel as well as the reopening
of the Surrey as a luxury hotel.
-
The select-service segment experienced
the greatest increase in supply during the observed period,
expanding at an average annual compounded rate of 3.9% from
1992 to 2009. In 2009, this segment experienced a roundly
20% increase in supply due to the opening of several properties
on the city block bounded by 39th and 40th Streets and Eighth
and Ninth Avenues. In 2009, the boutique segment recorded
the second-strongest increase in supply, growing by 3.5%;
this growth included the opening of several properties in
Midtown, such as the Ace Hotel, and in Downtown, such as the
Crosby Hotel.
-
As a result of the strong supply and demand
dynamics, average rate grew at an above-inflation level for
most segment types during the observed period, with the select-service
and limited-service segments exhibiting the strongest increases,
at 4.7%. The strong performances associated with the select-service
and limited-service segments indicated a notable amount of
unaccommodated demand for those two segments; this demand
is being accommodated by the large number of select-service
and limited-service hotels that opened recently in Manhattan
and continue to be absorbed. All segments were negatively
affected by the latest recession. Nevertheless, most segments
achieved occupancy levels at or above the 80% mark. The luxury
segment was the only one to maintain price integrity, with
an average rate decrease below that of the market. The below-market
performance experienced by the boutique segment is the result
of the lack of both a brand affiliation and a strong reservation
system, as well as its greater exposure to the financial sector.
|
|


