

Like restaurants and airlines, hotels offer experiential, temporal products that cannot be inventoried. The COVID-19 pandemic has temporarily reduced hotel demand to near zero; meanwhile, inventory continues to stream into the void unused. Thus, the hotel industry is experiencing unprecedented year-over-year hotel revenue losses. How long the direct impacts will continue remains to be seen, as does the collateral long-term impact; however, a significant RevPAR loss in 2020 is certain, and most experts expect post-pandemic results to remain below the pre-crisis benchmark year of 2019 for several years. In this environment, a central concern for hotel investors and operators is expense elasticity, representing the extent to which expenses can be reduced in proportion to revenue.
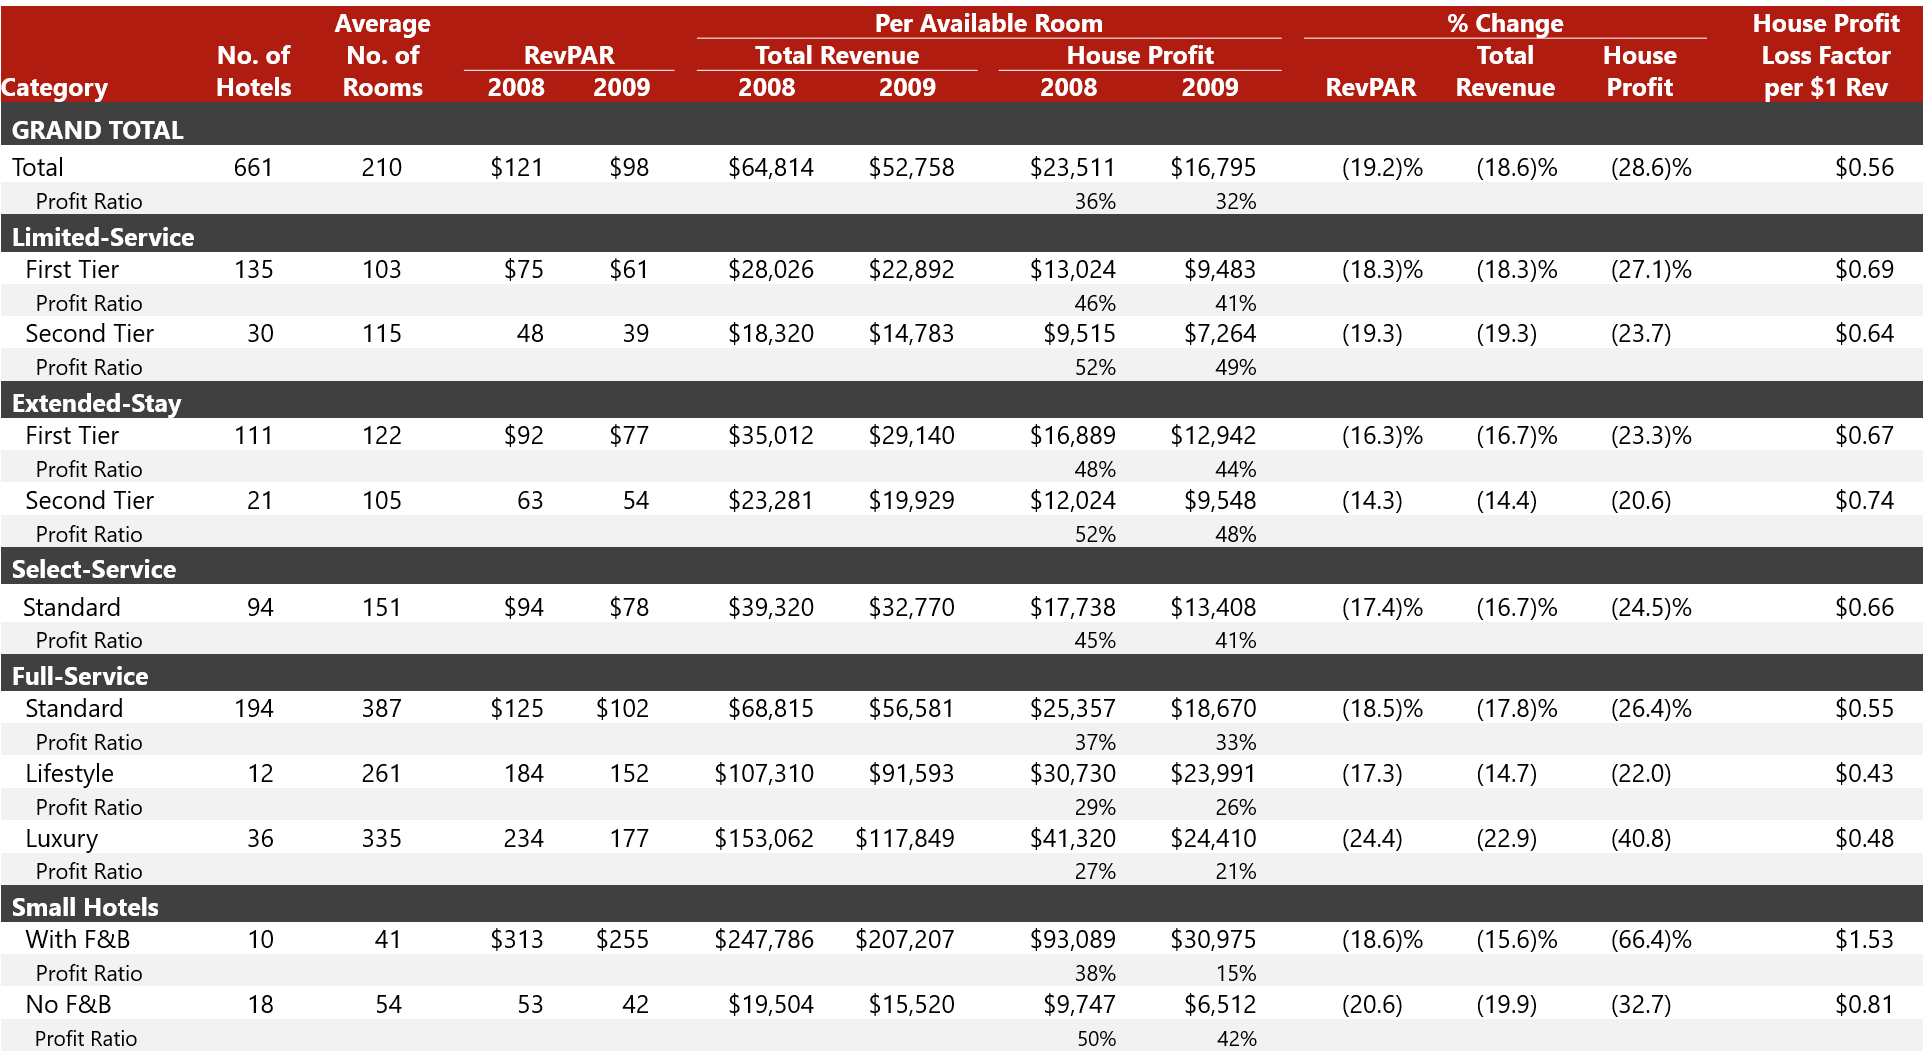
Using the HVS database, we identified 661 hotels (with an average of 210 rooms) that experienced material losses in revenue between 2008 and 2009. The following table summarizes the key metrics for this aggregate group and also provides a segregation by product type and quality level.
Summary of Key Metrics
Source: HVS
For all 661 hotels, the aggregate decline in RevPAR (revenue per available room: the product of occupancy and average daily rate) was 19.2%, roughly consistent with the industrywide decline in 2009. Total revenue fell by 18.6% and house profit declined by 28.6%.
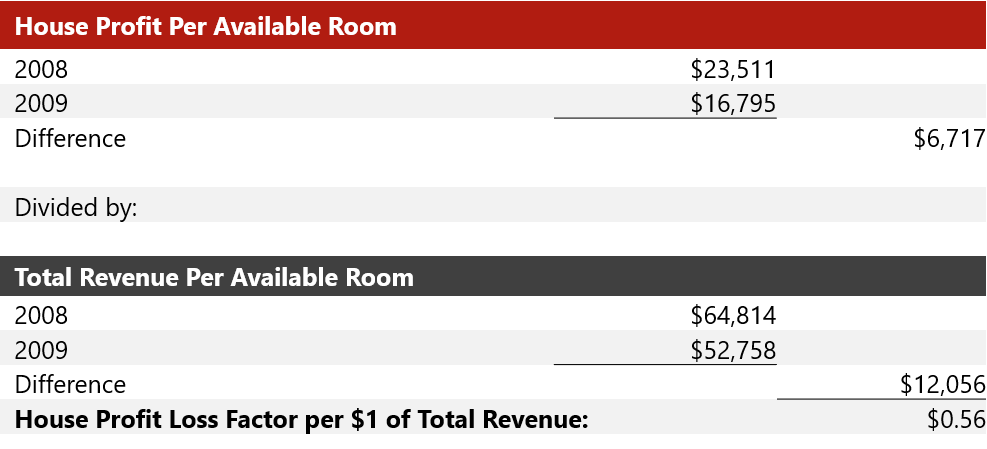
The percentage decline factors have the benefit of being easily understood, but an additional calculation is available using the preceding data, resulting in a metric of greater benefit. The rightmost column presented above converts the figures into a loss factor, which is calculated by dividing the per-available-room loss in house profit by the per-available-room loss in total revenue. For the survey at large, house profit declined by $0.56 for every $1.00 decline in total RevPAR, calculated as follows.
Calculation of House Profit Loss Factor
Source: HVS
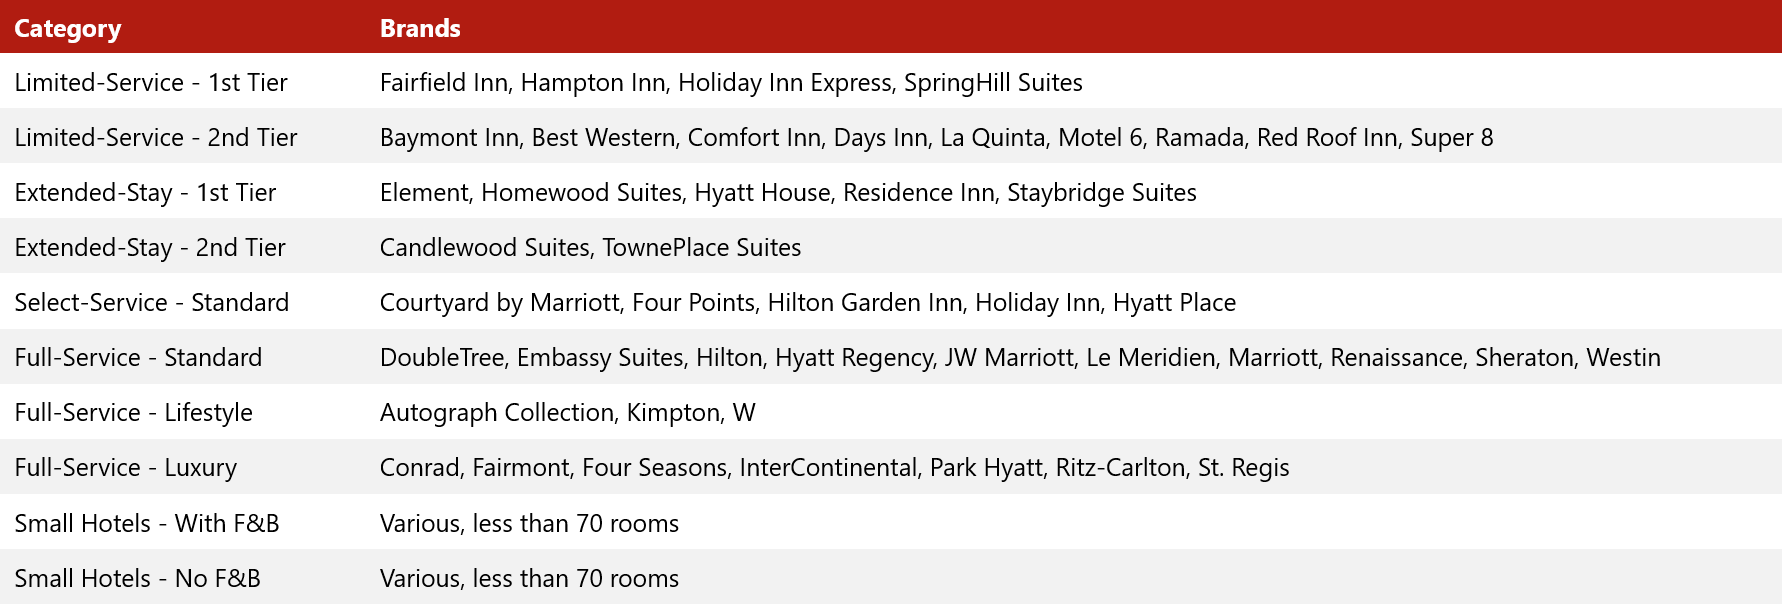
The higher the loss factor, the lower the degree of expense elasticity. The lower the loss factor, the higher the expense elasticity. Hotels with high expense elasticity have the greatest capacity for cost reductions. It stands to reason that larger hotels have the greatest expense elasticity because they have greater capacity for staffing reductions, as well as potential for temporary cuts to marketing and maintenance budgets. Thus, among the categories surveyed in Table 1, the full-service hotels have the lowest loss factors. The highest loss factors are indicated by the two categories of small hotels. Small hotels with food and beverage (F&B) are especially expense-inelastic, with each dollar of revenue lost resulting in a $1.53 loss in house profit. The small hotels were filtered to include only properties with fewer than 70 rooms. The other categories are best described by identifying the brands included therein.
Hotel Categories and Associated Brands
Source: HVS
A Forecasting Tool: The Variability Index
For readers interested in adapting the preceding data into a forecasting tool, we herewith repeat the methodology originally presented in a February 2009 article entitled “Putting the Past to Use: A Hotel Forecasting Tool for the Current Downtown,” which performed this same study using the 2001–2003 recession as the premise.
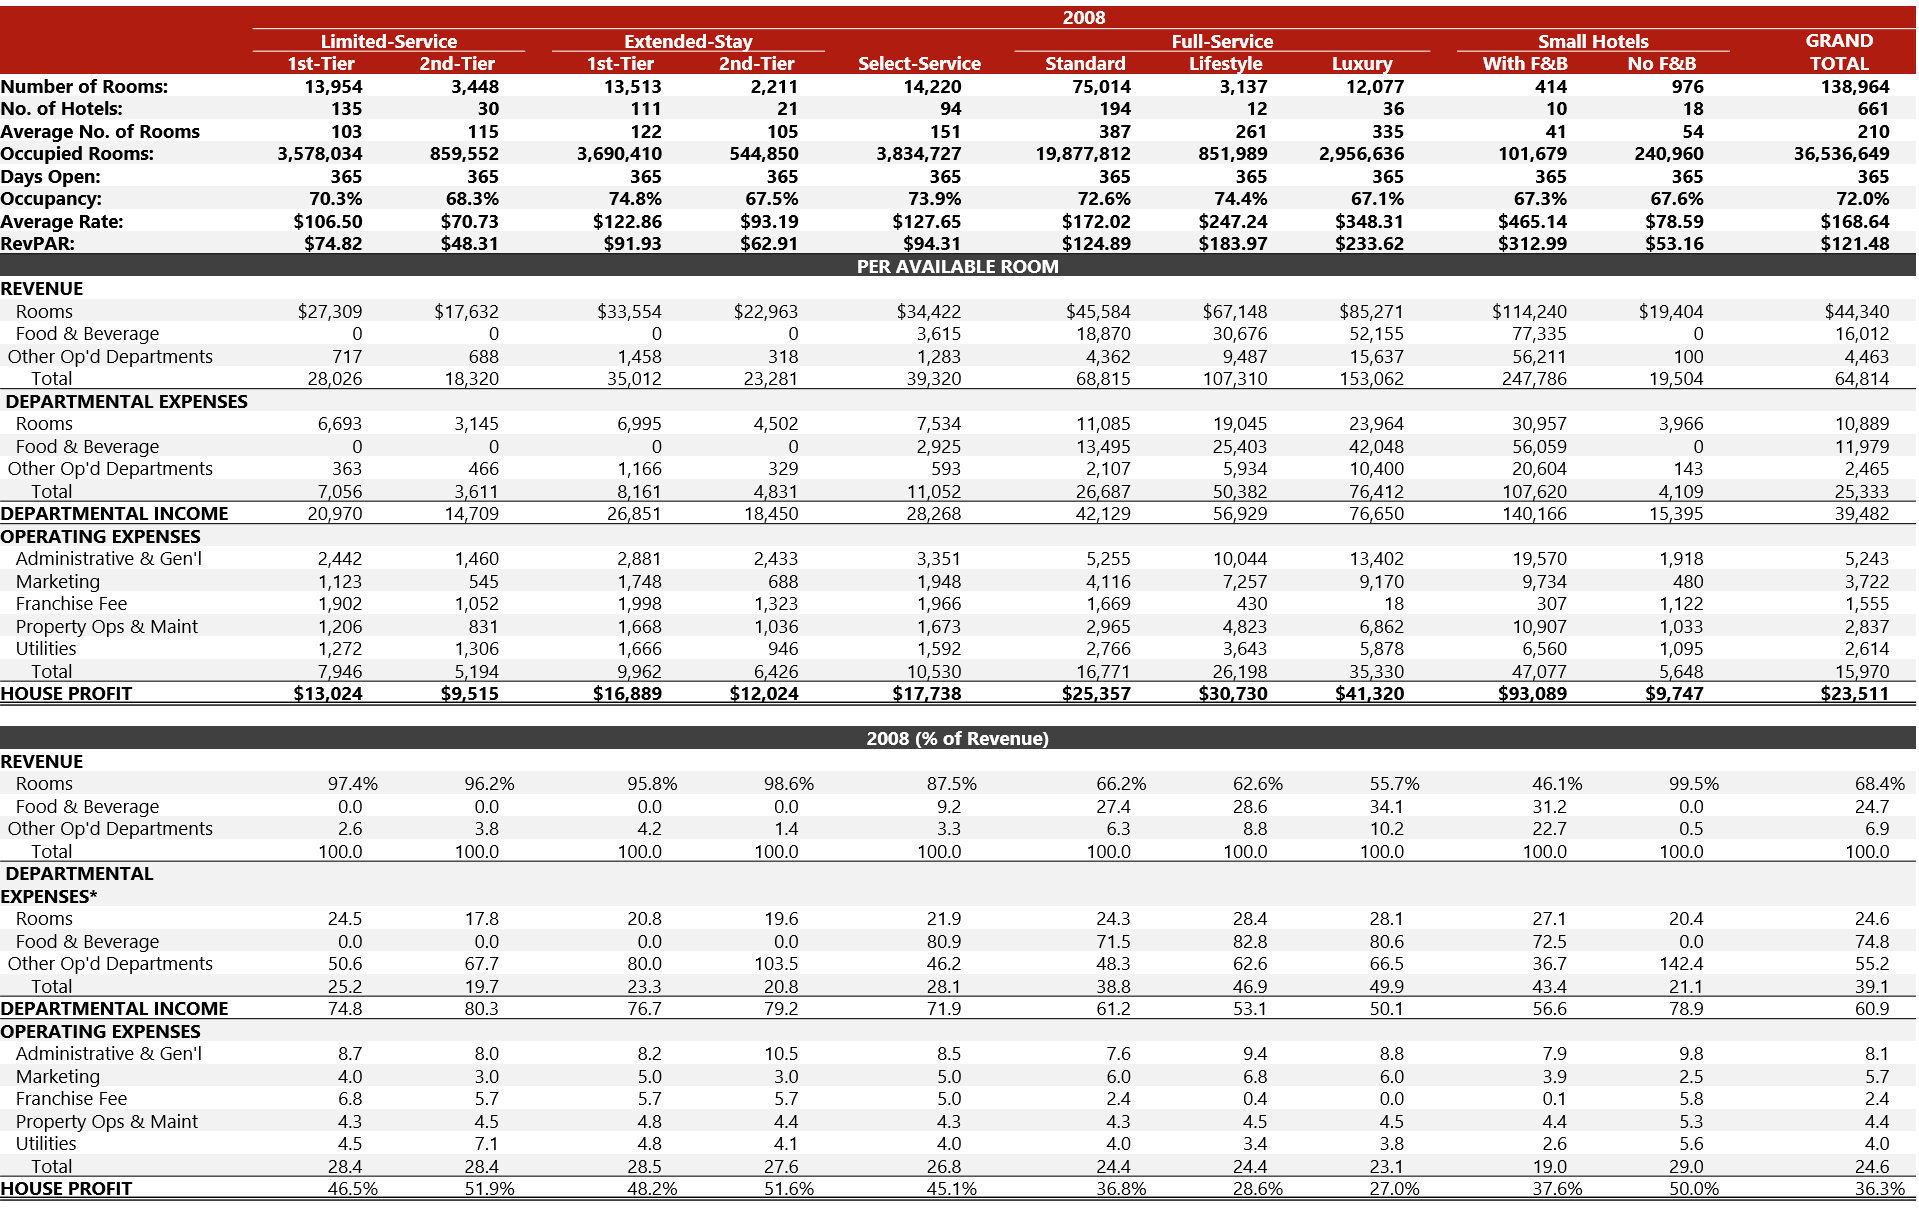
In that report, we developed a metric called a “Variability Index” to be deployed as a benchmarking tool. The following tables detail the data used to calculate the variability indices. In the subsequent text, we will explain the mathematical basis for the indices and demonstrate their application.
Raw Historical Data - 2008
Source: HVS
*Expressed as a ratio to departmental revenue
Raw Historical Data - 2009

Source: HVS
*Expressed as a ratio to departmental revenue
Percentage Change – 2008 to 2009
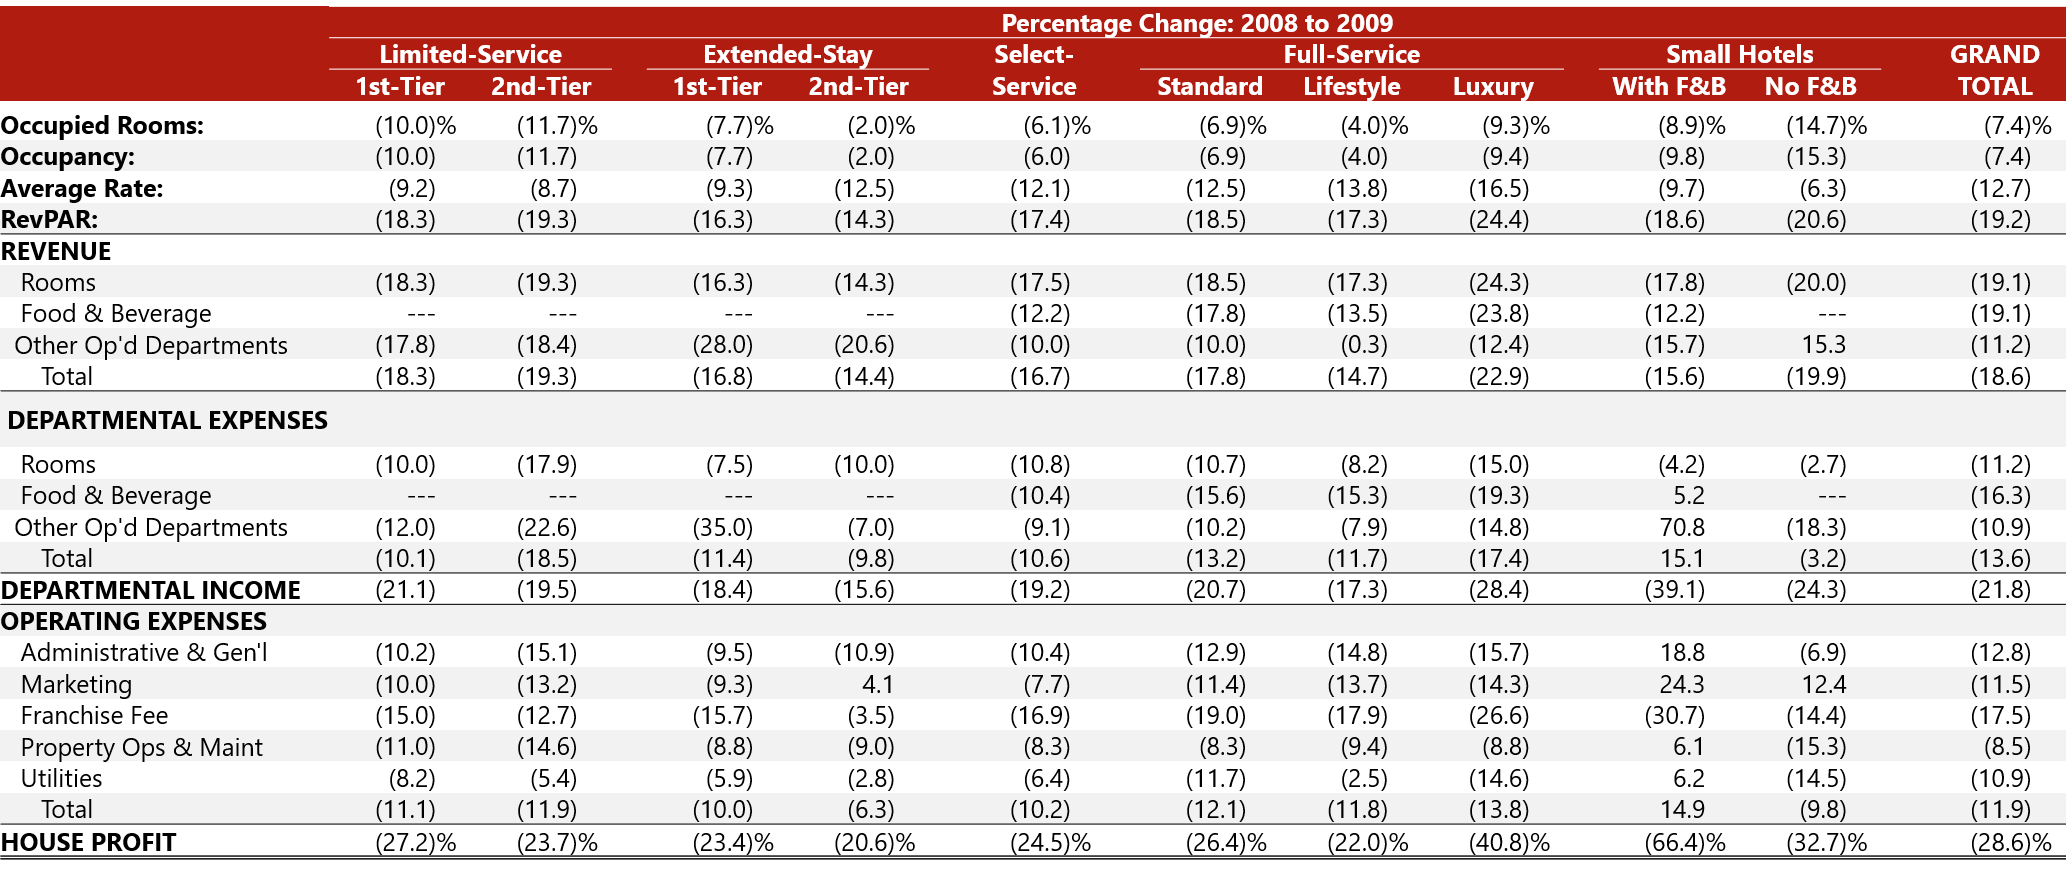
Source: HVS
Variability Indices
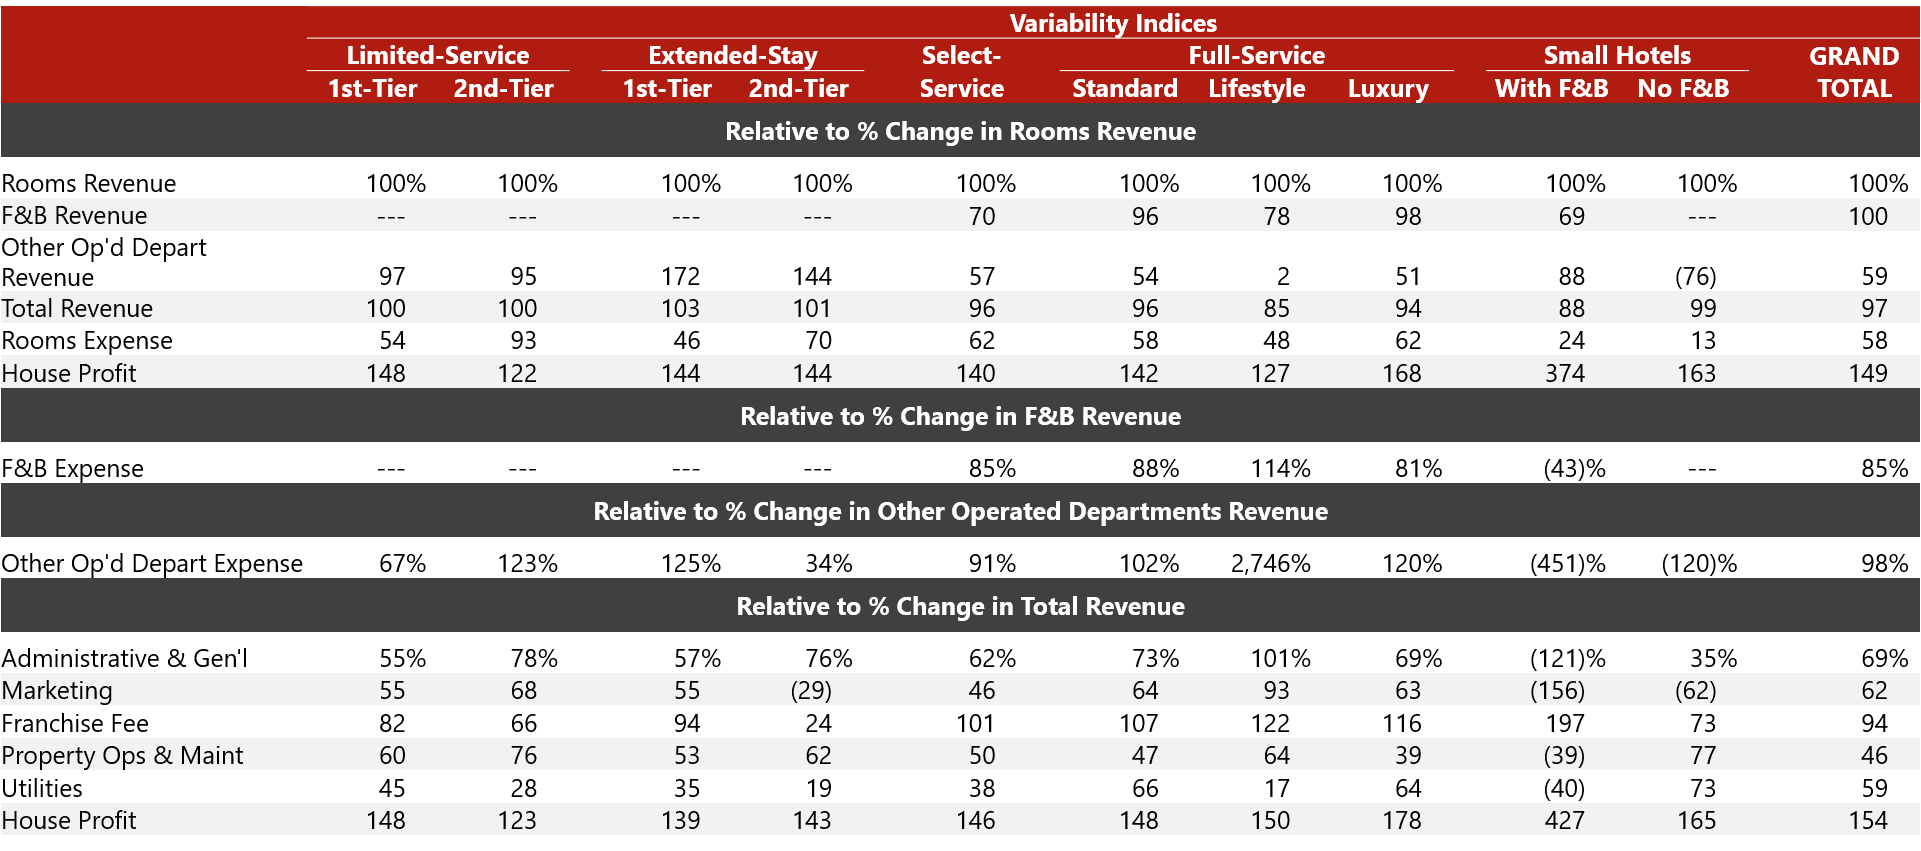
Source: HVS
The variability indices are calculated by dividing the two rates of change indicated for some defined pair of (at least partially dependent) revenue and/or expense line items, where the denominator is the base point of reference and the numerator is the dependent.
For example, in Table 6, for the Select-Service hotel category, rooms revenue declined by 17.5%, while F&B revenue in the same category declined by 12.2%. Dividing the F&B rate of decline by the rooms revenue rate of decline indicates a ratio of 70%. Expressed another way, F&B revenue was 70% variable with rooms revenue. In the same category (select-service hotels), other operated departments’ revenue was 57% variable with rooms revenue. The higher the index, the higher the degree of variability (or elasticity) with rooms revenue. The lower the index, the larger the fixed component. In cases where the index is negative (see most of the undistributed operating expenses in the Small Hotels with F&B category), the expense continued to grow in real terms despite the revenue loss.
From the standpoint of optimizing net income during a downturn, an operator hopes to see lower variability in revenue items and higher variability in expense categories. Utilities and maintenance expenses tend to have the lowest levels of elasticity.
Note that the line items studied here are restricted to those with a mix of fixed and variable expense components. Expenses that are totally variable are excluded (e.g., management fees and replacement reserves), as are fixed property-specific expenses, such as property taxes and insurance. The items reviewed here are hybrids, and the question of how much is directly variable with declining revenue is at the heart of this study. In addition, note that, in the interim between the previous economic downturn and today, the Uniform System of Accounts for the Lodging Industry (USALI) was revised to create a new category called Information & Telecommunications Systems, which captures expenses previously categorized as Other Operated Departments and Administrative & General expenses. In the absence of historical data for this new item, we advise using the Administrative & General variability index.
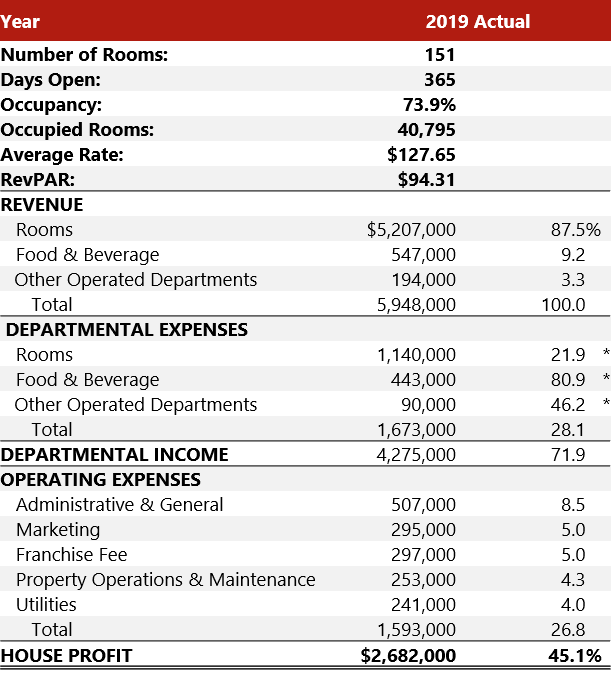
A Case Study
Assume you are the asset manager of a 151-room, select-service hotel, where the actual 2019 performance results reflect the following:
Actual 2019 Results – Hypothetical 151-Room, Select-Service Hotel
Source: HVS
*Expressed as a ratio to departmental revenue
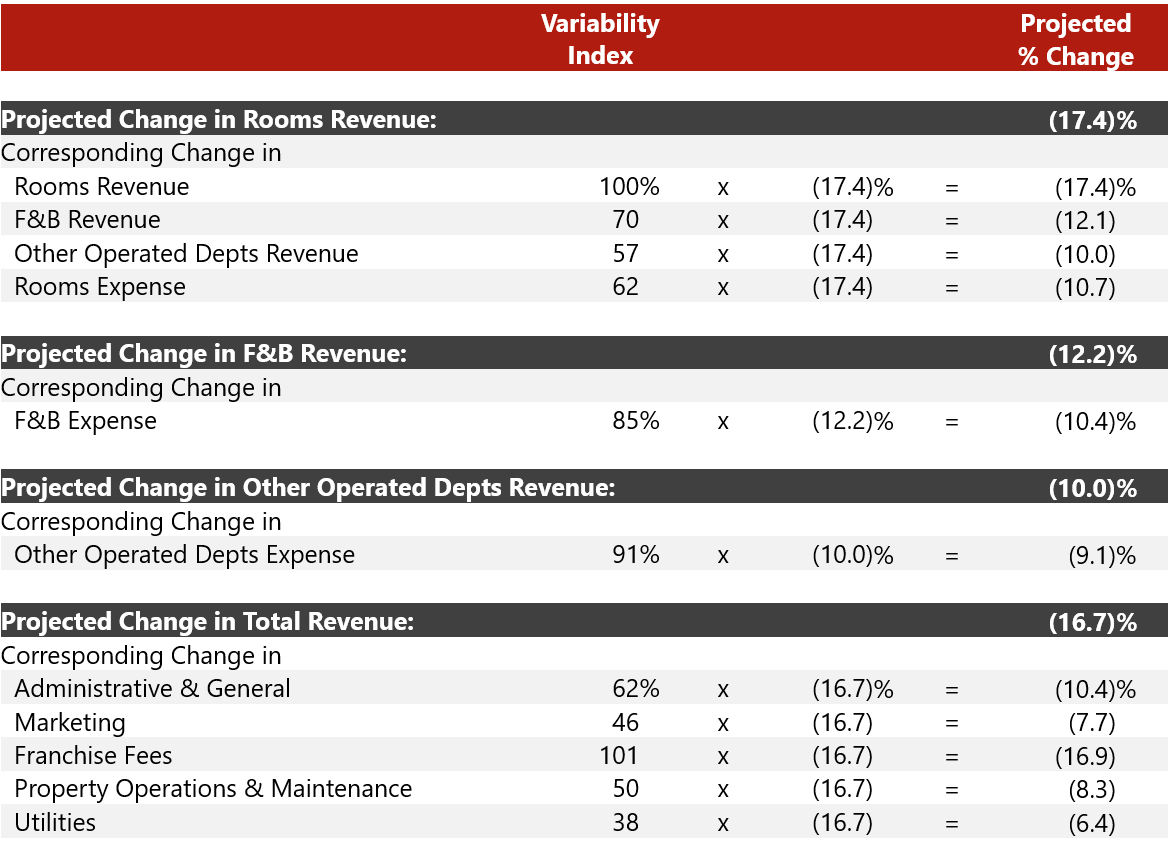
Given current events, hotel management is projecting 2021 occupancy of 69.4% at an average rate (ADR) of $112.19, for a RevPAR of $77.91, a 17.4% decrease from 2019. Using this change rate as the basis, the following other change rates can be calculated using the relevant variability indices.
Rate of Change Projections – 2021
Source: HVS
By applying the preceding change rates, the property’s 2021 results are projected as follows.
Forecasted Results - 2021
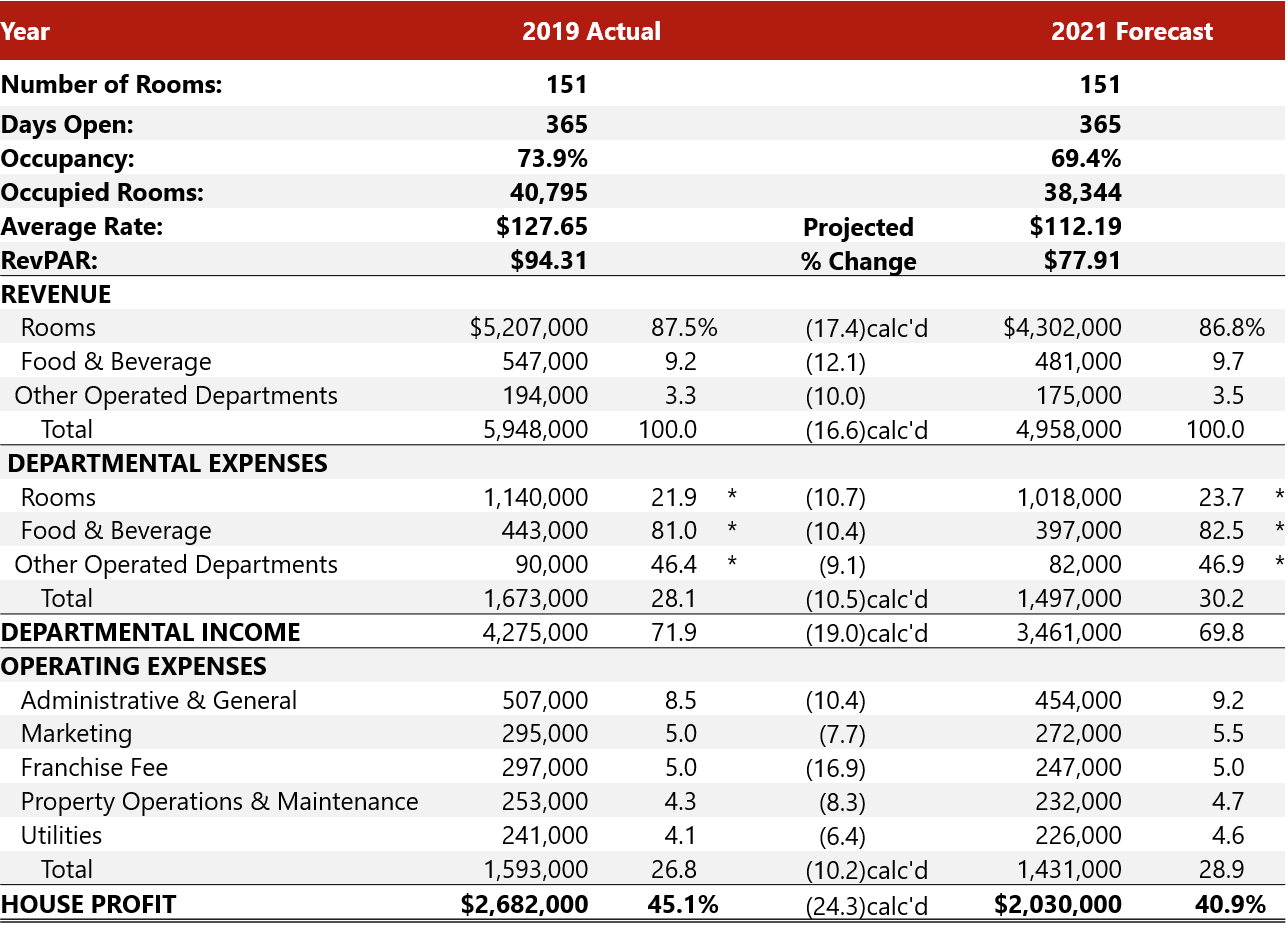
Source: HVS
*Expressed as a ratio to departmental revenue
We used the aggregate 2008 occupancy, ADR, and income and expense ratios for the Select-Service category (presented in Table 4) as the basis for the 2019 actual data in this case study. We then used this same category’s 2009 occupancy and ADR results as the basis for the 2021 forecast. Because the case study’s 2021 projected results match the actual 2009 income and expense ratios, the preceding case example also works as a mathematical proof of the tool.
Conclusion
The variability indices developed here provide hotel investors and operators a market-derived forecasting tool. Segregated over ten hotel categories, the indices allow an analyst with a given rate of rooms revenue loss to either build a ground-up forecast or confirm that an existing forecast is reasonable.
About Erich Baum
0 Comments
Success
It will be displayed once approved by an administrator.
Thank you.
Error